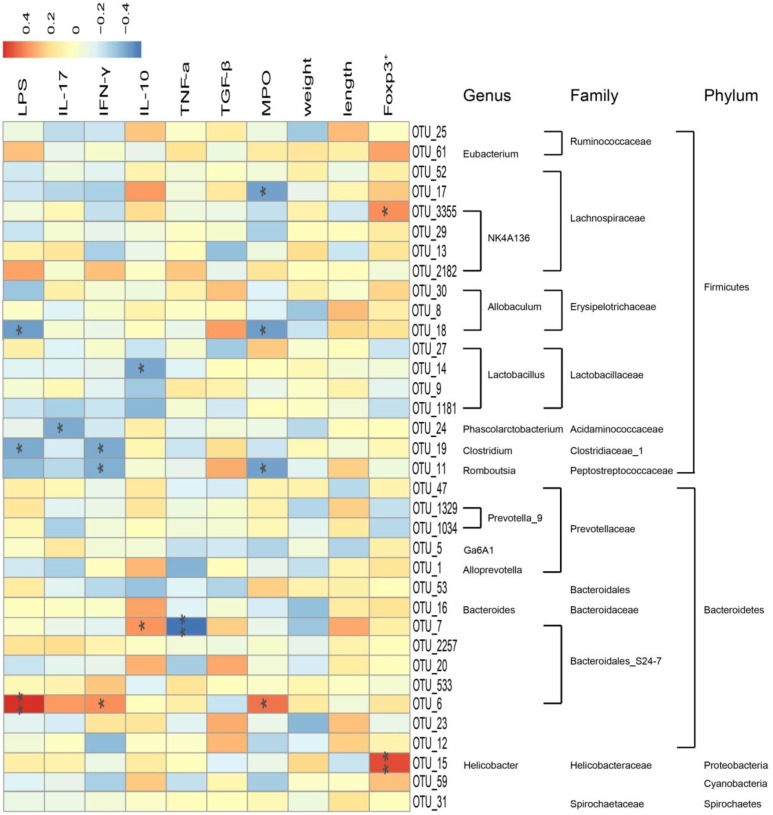
FIGURE 9.
Correlation between 35 key operational taxonomic units (OTUs) and related indexes in rat. Data are expressed as the mean ± SD (n = 3). Correlation between the represented bacteria taxa information (genus, family, and phylum) of 35 key OTUs and related indexes in IBD rats. Pearson product moment correlation coefficients are represented by color, ranging from blue, negative correlation (–0.4) to red, positive correlation (0.4). Significant correlations after P-value adjustment are marked by ∗p < 0.05 and ∗∗p < 0.01.

