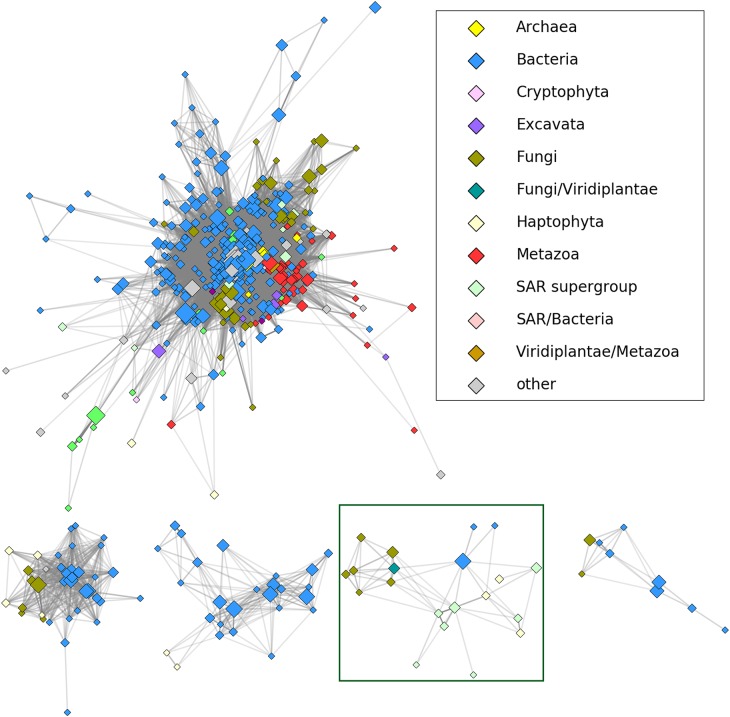
FIGURE 1.
The results of CLANS clustering of nucleoside hydrolase homologs at 1E-30 E-value threshold. HopQ1 amino acid sequence was used as a query to search for homologs using jackhmmer tool (https://www.ebi.ac.uk/Tools/hmmer/search/jackhmmer; sequence significance E-value - 0.01; hit significance E-value - 0.03). After two iterations, CD-HIT (http://weizhongli-lab.org/cdhit_suite/cgi-bin/index.cgi?cmd=cd-hit) (Huang et al., 2010) clustering at 90% sequence identity cut-off and manual reduction of the number of hits, the remained sequences were analyzed by CLANS (https:// toolkit.tuebingen.mpg.de/#/tools/clans) program from the same toolkit. The CLANS program allows to join sequences with high homology and closest evolutionary connection into groups (clans). The five largest clans are depicted including HopQ1 homologs (HLPs). A reduced representation (sequences grouped at 70% percentage identity with CD-HIT) was used to visualize the connections in CytoScape (Shannon et al., 2003). Node color corresponds to taxonomic classification, node size is proportional to the number of sequences grouped (logarithmic scale). Shading of the edges corresponds to the best BLAST E-value (stronger similarities equal darker edges). The initial visualization was obtained in CytoScape using edge-weighted, spring-based layout and the final positions were manually adjusted for clarity. The HopQ1 clan is surrounded by a green line.

