
FIGURE 3.
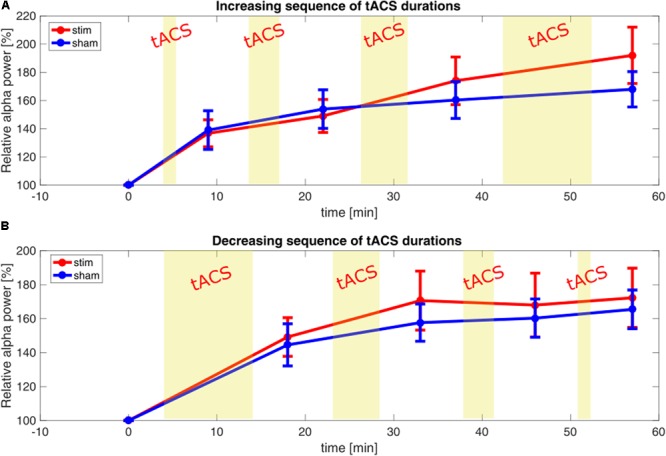
Relative parietal α-power post-stimulation. (A) Time-course of α-power relative to baseline, comparing increasing-sequence stimulation group (red) and sham (blue). Each point represents the average power of a 9-min observation window. Yellow bars represent blocks of stimulation. Error bars depict the standard error of the mean. (B) Time-course of α-power relative to baseline, comparing decreasing-sequence stimulation group (red) and sham (blue): each point represents the average power of a 9-min observation window. Yellow bars represent blocks of stimulation. Error bars depict standard error of the mean.