
Figure 11.
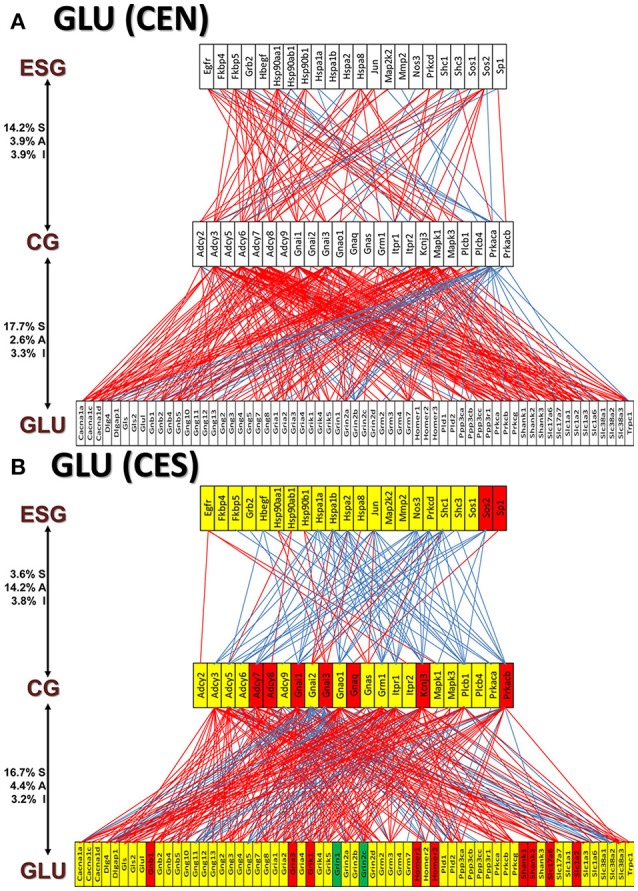
The transcriptomic networks by which the estrogen-signaling (ESG) pathway genes regulate the glutamatergic synapse (GLU) genes through expression coordination with the common genes (CG) between the two pathways in OVX rats with E2-replacement. (A) Networks in the DG of non-SE animals. A red/blue line indicates that the linked genes are significantly (p-value < 0.05) synergistically/antagonistically expressed, respectively. Numbers on the left side represent the percentages of the synergistically (S)/antagonistically (A)/independently (I) expressed pairs that can be formed between the two groups of genes. (B) Networks in the DG of SE animals. Red/green/yellow background of the gene symbol indicates that that gene was up-/down-/not regulated by SE. Note that there is a substantial shift from synergistic to antagonistic expression between ESG and CG groups in SE animals.