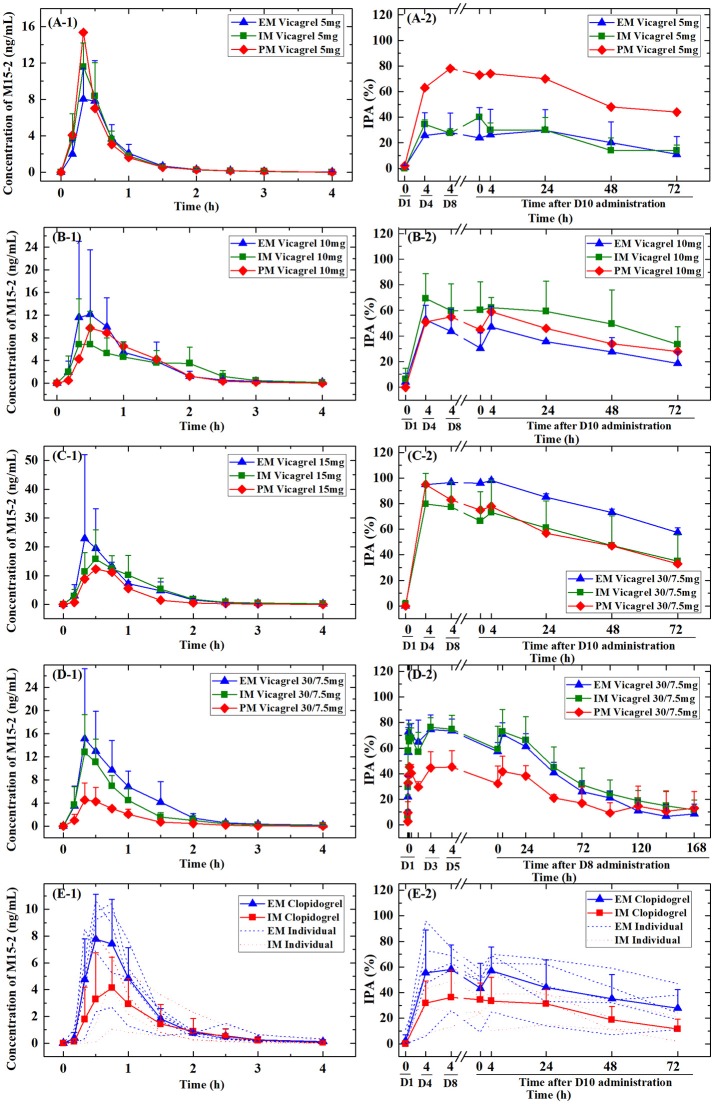
Figure 3.
Plasma concentrations of active metabolites and the corresponding inhibition of platelet aggregation (IPA%) of vicagrel and clopidogrel stratified by CYP2C19 polymorphism for each treatment group. EM, extensive metabolizers; IM, intermediate metabolizers; PM, poor metabolizers. (A-1,B-1,C-1,D-1,E-1) The M15-2 PK profiles of vicagrel (5, 10, 15, 30/7.5 mg) and clopidogrel (75 mg), (A-2,B-2,C-2,D-2,E-2) The IPA% of vicagrel (5, 10, 15, 30/7.5 mg) and clopidogrel (75 mg).

