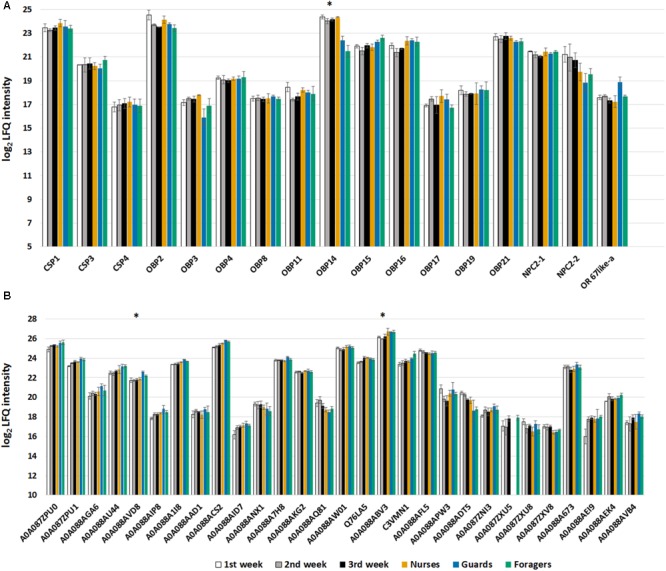
FIGURE 6.

(A) Bar chart reporting the log2 transformed and imputed LFQ intensity values of the olfactory proteins, averaged for biological replicates (±SE). Proteins marked with an asterisk are significant to t-test (Benjamini Hochberg-corrected FDR = 5%) for the comparison nurse-old workers (guards and foragers). (B) Bar chart reporting the log2 transformed and imputed LFQ intensity values of the ODEs, indicated with Uniprot accession number, averaged for biological replicates (±SE). Proteins marked with an asterisk are significant to t-test (Benjamini Hochberg-corrected FDR = 5%) for the comparison 2nd week-guards.
