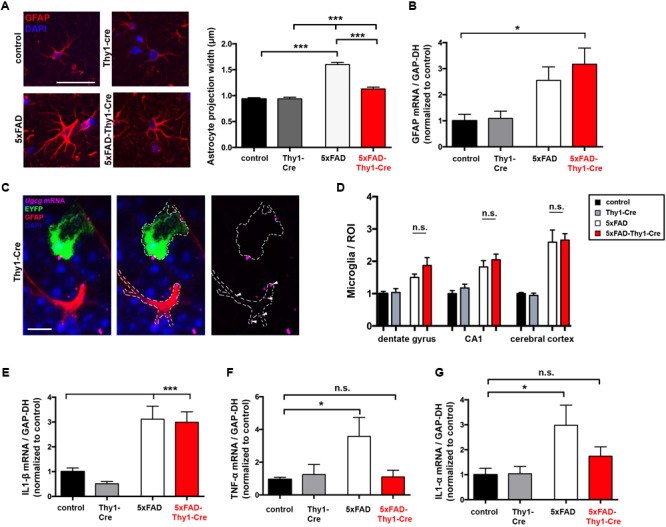
FIGURE 7.

Thickening of astrocytic processes and expression of TNF-α and IL1-α are less pronounced in 5xFAD-Thy1-Cre mice. (A) A glial fibrillary acidic protein (GFAP) staining of astrocytes in the hippocampal dentate gyrus (between lateral 0.96 and 1.2 mm (sagittal)) depicts astrocytic processes. Astrocytic process width is significantly elevated in 5xFAD mice. In comparison to 5xFAD mice, the thickening of astrocytic processes is less pronounced in 5xFAD-Thy1-Cre mice (n = 348 (control); 378 (5xFAD); 320 (Thy1-Cre); 312 (5xFAD-Thy1-Cre) projections derived from 73 control, 88 5xFAD, 68 Thy1-Cre, 74 5xFAD-Thy1-Cre cells (three mice per group); scale bar = 50 μm). (B) A quantitative mRNA expression analysis from hippocampal tissue shows that GFAP expression is elevated in both 5xFAD and 5xFAD-Thy1-Cre mice. Expression levels have been normalized to glyceraldehyde-3-phosphate dehydrogenase (GAPDH) expression (n = 7 control; 5 5xFAD; 9 Thy1-Cre; 8 5xFAD-Thy1-Cre mice). (C) An ISH shows that glial cells of Thy1-Cre mice express Ugcg mRNA and that they are not targeted by GCS deletion (scale bar = 10 μm). The original brown ISH dots have been converted to purple fluorescence, as described in the respective Materials and Methods section. For comparison, the original image is depicted in Supplementary Figure 8A. (D) The number of ionized calcium binding adaptor molecule 1 (Iba1)-positive microglia is elevated in dentate gyrus, CA1, and cerebral cortex of both 5xFAD and 5xFAD-Thy1-Cre mice (n = 7 (control, Thy1-Cre, 5xFAD) and 8 (5xFAD-Thy1-Cre) sections (ROIs) derived from 5 control or 5xFAD-Thy1-Cre and 4 5xFAD or Thy1-Cre mice). (E) A quantitative mRNA expression analysis from hippocampal tissue shows that IL1-β expression is significantly elevated in both 5xFAD and 5xFAD-Thy1-Cre mice. Expression levels have been normalized to GAPDH expression (n = 7 control; 5 5xFAD; 9 Thy1-Cre; 8 5xFAD-Thy1-Cre mice). (F,G) Quantitative mRNA expression analyses from hippocampal tissue show that tumor necrosis factor-α (TNF-α) and interleukin 1-α (IL1-α) expression levels are significantly elevated in 5xFAD mice. However, the expression of these cytokines is not significantly elevated in 5xFAD-Thy1-Cre mice. Expression levels have been normalized to GAPDH expression (n = 7 control, 5 5xFAD, 9 Thy1-Cre, 8 5xFAD-Thy1-Cre mice). Means ± SEM. Statistical analysis for all four groups was performed by one-way ANOVA with Tukey’s test for multiple comparison (95% confidence interval). Means ± SEM.
