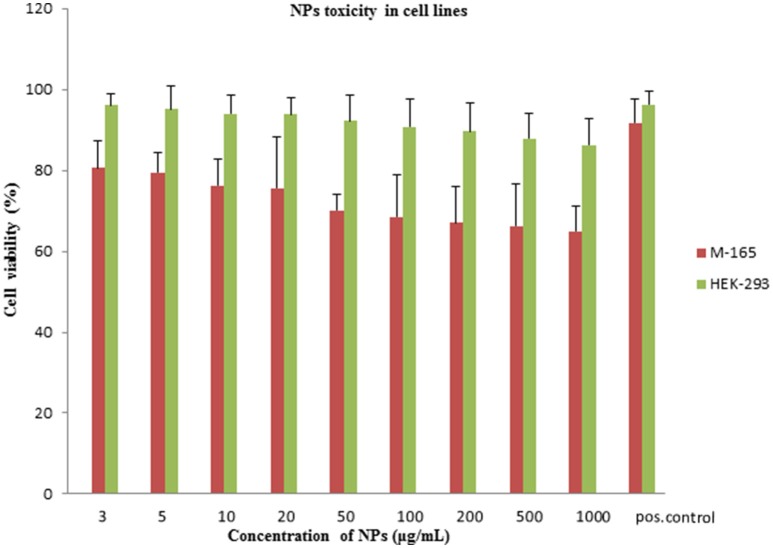
Figure 5.
Viability assay on M165 and HEK293 cell lines. Graph of MTT assay after 24 h treatment of M-165 cells and HEK293 cells with various concentrations of NPs. Positive control shows M-165 cells and HEK293 cells without the exposure to NPs. The cell viability is expressed as % cell viability in comparison to a positive control.

