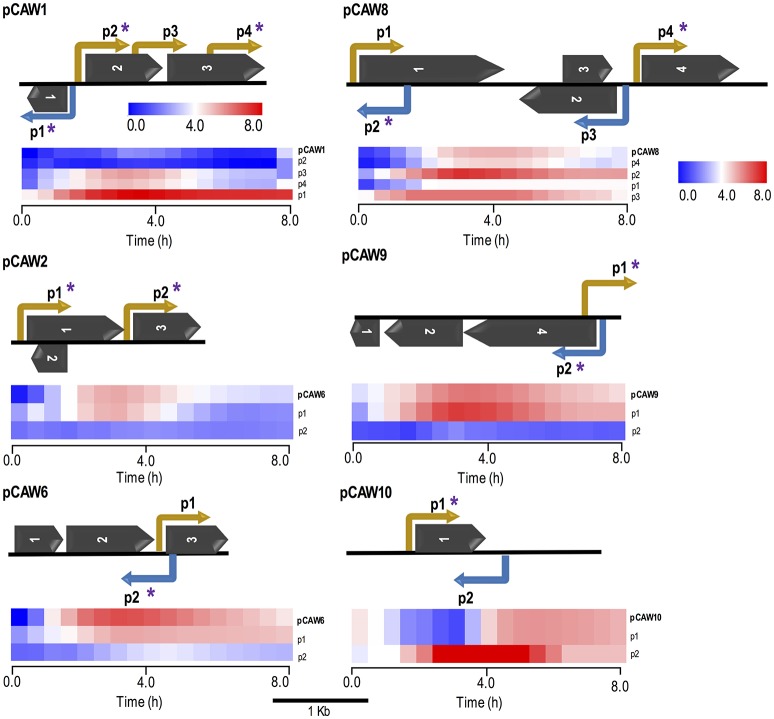
Figure 3.
Schematic representation of six metagenomic inserts (contigs) showing predicted ORFs and experimentally validated/characterized promoters. Each contig is identified on the far left of each subfigure. Promoters are indicated by elbow-shaped arrows and name according to their relative position in the contig. Promoter directionality, regarding the leading and lagging strands, is represented by yellow and blue colors, respectively. Asterisks over specific promoters indicate regulatory regions which were cross-validated by matching in silico predictions. Dark arrows represent predicted ORFs, according to their relative positions in each contig (see Table 2 for more information). All genetic features respect their original relative sizes, following the 1 kb scale depicted at the bottom of this figure. Beneath each metagenomic insert, there is a heat map cluster representing the whole set of promoter activities measured during 8-h fluorescence assays. The first line of each cluster shows the original expression profile initially measured for each metagenomic insert. All other lines represent expression activities from de novo experimentally validated promoters within each contig (small DNA fragments). The second line of each cluster represents the endogenous promoter showing the most similar activity with respect to the original expression profile for each contig. All expression profiles are properly identified at the most rightmost side of each line, following their respective contig/promoter name. For the supplementary set of analyzed contigs, see Figure S4.

