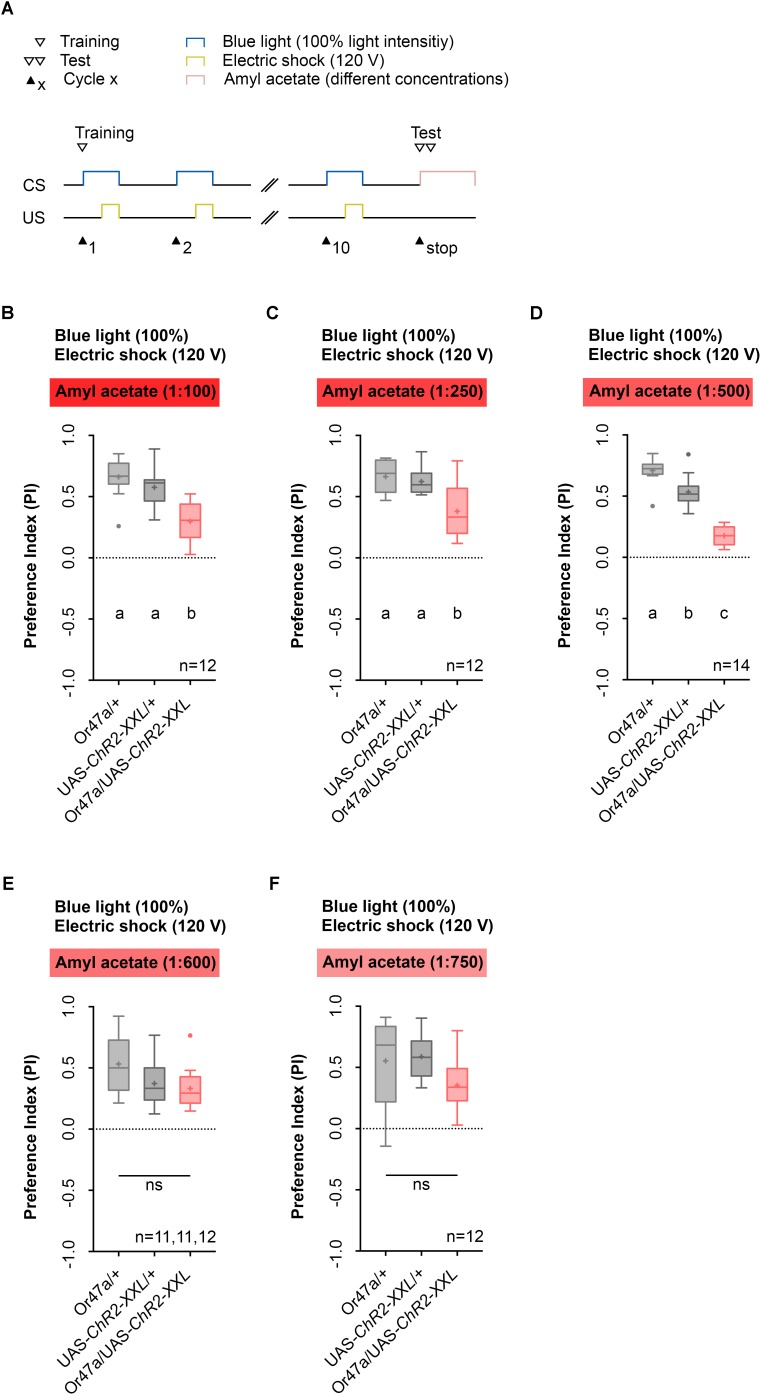
FIGURE 4.
Pairing optogenetic Or47a activation with electric shock leads to the formation of odor-electric shock learning and memory in Drosophila larvae tested at lower amyl acetate dilutions. (A) Timescale of associative conditioning using 10 cycles, 120 V for electric shocks and continuous blue light with an intensity of 100%. For the olfactory preference test amyl acetate with different dilutions (1:100, 1:250, 1:500, 1:600, and 1:750) was used. (B) The expression of ChR2-XXL in ORN 47a led to a reduction of olfactory preference for amyl acetate at a dilution of 1:100 (Tukey post hoc test, p < 0.0001, p = 0.0003, respectively). All three groups showed (an olfactory preference for amyl acetate statistically significant from zero (one sample t-test, p < 0.0001 for all three groups). (C) The expression of ChR2-XXL in ORN 47a led to a reduction of olfactory preference for amyl acetate at a dilution of 1:250 (Dunn’s multiple pairwise comparison, p = 0.0.0035, p = 0.0307, respectively). All three groups showed olfactory preferences for amyl acetate statistically significant from zero (one sample t-test, p < 0.0001 for all three groups). (D) The expression of ChR2-XXL in ORN 47a led to a reduction of olfactory preference for amyl acetate at a dilution of 1:500 (one-way ANOVA, p < 0.0001). However, both control groups (Or47-Gal4/+ and UAS-ChR2-XXL/+) exhibited olfactory preferences, which are statistically significant form each other (Tukey post hoc test, p = 0.0001). All three groups showed an olfactory preference for amyl acetate statistically significant from zero (one sample t-test, p < 0.0001 for all three groups). (E) All three groups showed olfactory preferences for amyl acetate at a dilution of 1:600, which are statistically significant from zero (one sample t-test, p < 0.0001 for all three groups) but statistically not significant from each other (one-way ANOVA, p = 0.057). (F) All three groups showed olfactory preferences for amyl acetate at a dilution of 1:750, which are statistically significant from zero (one sample t-test, p = 0.0002, p < 0.0001, p = 0.0002, respectively) but statistically not significant from each other (one-way ANOVA, p = 0.0746). Differences between groups are depicted below the respective box plots, at which ns indicates p ≥ 0.05. Different lowercase letters indicate statistical significant differences at level p < 0.05. Small circles indicate outliers. Sample size is indicated with the letter n.

