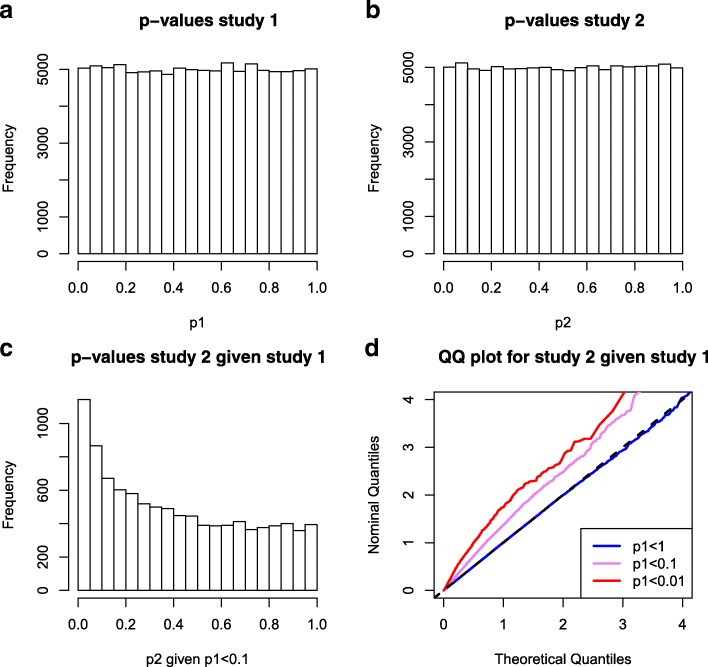
Fig. 1.
Simulated GWAS pairs with overlapping samples. Data was simulated for two quantitative trait GWAS with no genetic effects but overlap in samples (each with n=12,500 including 5000 overlapping samples). d=100,000 SNPs were simulated under the null model (phenotype is simulated independent from genotype). Panel a: the p-value distribution for trait 1; Panel b: the p-value distribution for trait 2; Panel c: The p-value distribution for trait 2 given that the p-value in study 1 was less than 0.1; Panel d: quantile-quantile plot for the p-values in study 2, stratified by the p-value in study 1

