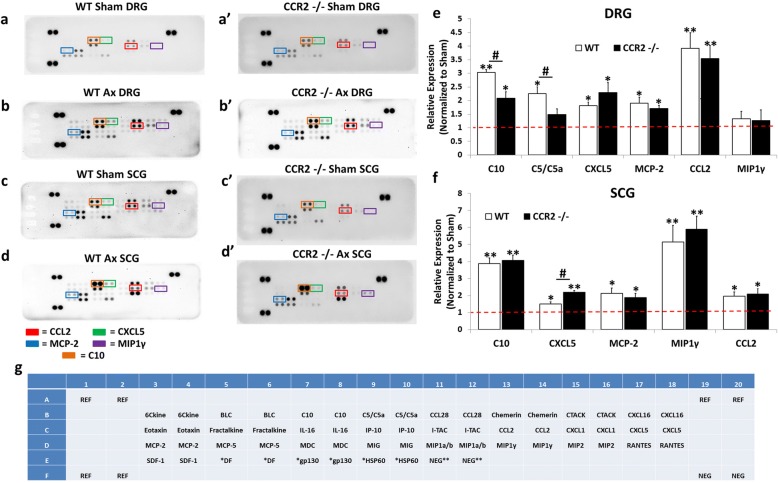
Fig. 2.
Chemokines are differentially expressed in the DRG and SCG 48 h after axotomy. Mice underwent a unilateral transection of the right sciatic nerve and the right ICN and ECN of the SCG. Forty-eight hours after axotomy, the injured and contralateral sham-operated L4/L5 DRG and SCG were collected and flash frozen. Protein was isolated from sham and injured ganglia pooled from five mice and used for measurement of chemokines using a Proteome Profiler Mouse Array kit (g). Representative arrays for WT [85] and Ccr2−/− (a’–d’) mice for DRG (a, a’, b, b’) and SCG (c, c’, d, d’) are shown. Array images were analyzed by densitometry for integral optical density using ImageJ. The optical density for each cytokine was then normalized to the internal control for each blot. The data are represented as the fold increase in the expression of the injured condition compared to the sham for each genotype for DRG (e) and SCG (f). The spots corresponding to the cytokines CCL2, CXCL5, CCL8/MCP-2, MIP-1γ, and CCL6/C10 are highlighted in the representative arrays based on the template indicating the location of controls and various chemokine capture antibodies (g). N = 3 arrays per group. The data are presented as mean ± SEM. *p < 0.05. **p < 0.001 represents significance of expression relative to sham within genotype. #p < 0.05. ##p < 0.001 represents significance between genotypes

