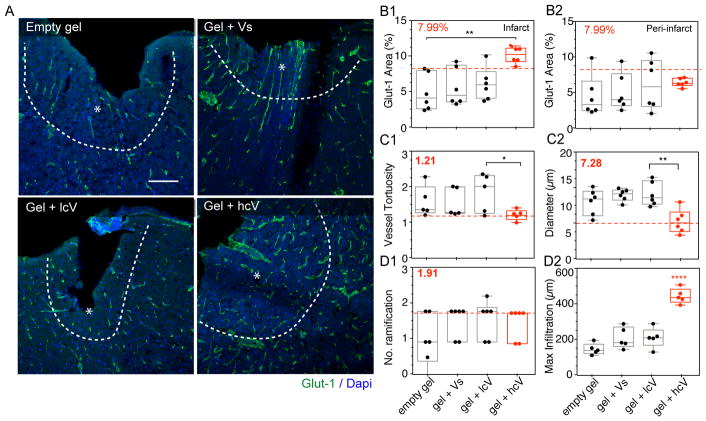
Figure 2. Long-term post-stroke vascular growth.
(A) Fluorescent images of vessels (Glut-1) in and around the stroke site (*) 16 weeks after gel transplantation. (B) Quantification of the vascular density (% Glut-1 area) in and around the stroke site (*), Quantification of the vessel morphology: vessel tortuosity = total vessel length/shortest distance (C1) and diameter (C2), Quantification of vessel growth with number of ramifications = the number of branches/vessel (D1) and maximum infiltration distance of the vessels into the stroke site (D2). In all plots, the dotted red line and red number indicates the value for the give quantification of the contralateral side. Empty gel = gel = HA hydrogel, Vs = 200 ng of soluble VEGF, lcV = 1μg nH loaded with 200 ng VEGF, hcV = 0.01 μg nH loaded with VEGF and 0.99 μg unloaded nH. Data is presented using a min to max box plot. Each dot in the plots represents one animal and p values were determined by One-way ANOVA with a Tukey’s post-hoc test, with *, ** and **** indicating p < 0.05, p < 0.01 and p < 0.0001, respectively. Scale bar: 100 μm.

