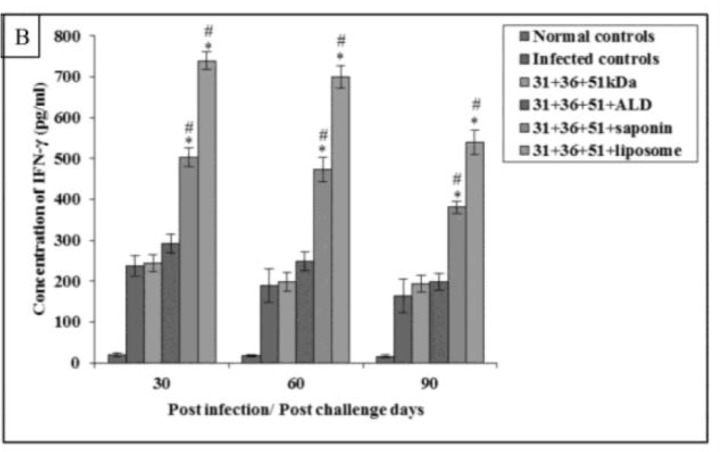
Fig.4B:
IFN-γconcentration in infected and immunized mice on different post challenge days. The data is presented as mean±S.D. of six mice per group
P-value: Infected controls vs. 31+36+51kDa; 31+36+51+ALD; 31+36+51+saponin; 31+36+51+liposome. *(P<0.001)
P-value: 31+36+51kDa vs. 31+36+51+ALD; 31+36+51+saponin; 31+36+51+liposome. #(P<0.001)

