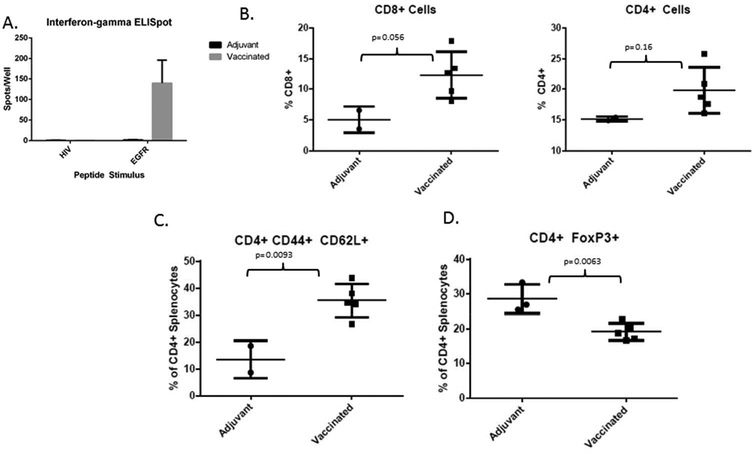
Figure 4. Immunologic Consequences of Vaccination.
A. Interferon-gamma ELISpot conducted on splenocytes isolated from adjuvant treated and vaccinated animals at the completion of the 18 week experiment, demonstrating a robust and specific immune response to the EGFR peptides in vaccinated animals. This assay was conducted with the splenocytes from animals in the first bioassay.
B. CD8+ cells expressed as a percentage of total live splenocytes isolated from the spleens of adjuvant treated (n=2) and vaccinated animals (n=5) at the experimental endpoint (left); CD4+ cells expressed as a percentage of total live splenocytes isolated from the spleens of adjuvant treated and vaccinated animals at the experimental endpoint (right). All flow cytometry experiments were performed on splenocytes isolated from animals in the second bioassay (panels B-D) due to sample availability.
C. CD44+ CD62L+ (double positive) cells expressed as a percentage of the total live CD4+ pool isolated from the spleens of adjuvant treated (n=2) and vaccinated animals (n=5) at the experimental endpoint.
D. FoxP3+ cells expressed as a percentage of the total live CD4+ pool isolated from the spleens of adjuvant treated (n=3) and vaccinated animals (n=5) at the experimental endpoint.

