
Figure 1.
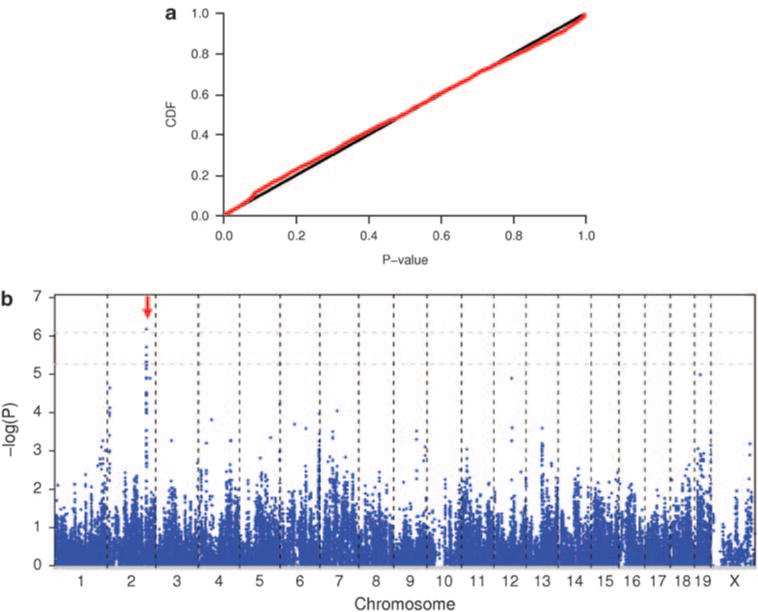
The results from genome-wide association analysis of spontaneous lung tumor in inbred mice. (a) Cumulative distribution of P-values from the EMMA approach in the GWAS. cdf refers to cumulative distribution function. (b) Scatter plot of P-values in −log scale for 84 010 SNPs. The two gray lines are genome-wide thresholds of P=0.05 and P=0.10, which correspond to point-wise P-values of 8.24 × 10⁻⁷ and P = 5.43 × 10⁻⁶, respectively.