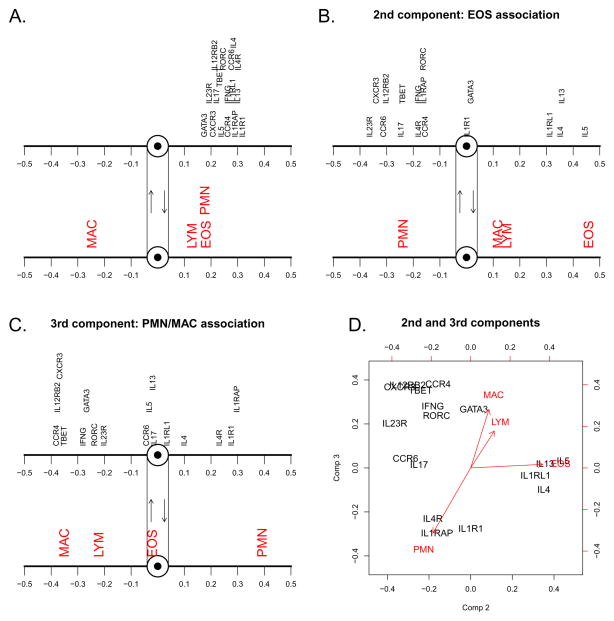
Figure 2. Loadings plot for the three orthogonal latent components.
Structure of the three independent components of the PLS regression analysis of gene expression levels vis-à-vis cell differentiation in sputum A. X loadings (genes) and the corresponding Y loadings (cells) for the first component. B. X and Y loadings for the second component. C. X and Y loadings for the third component. D. X and Y loadings for the second component (horizontal axis) and third component (vertical axis).

