
Figure 2. CD4+CD8α−SLAMF7+ TEM cells are expanded in patients with active untreated IgG4-RD and decrease following glucocorticoid treatment.
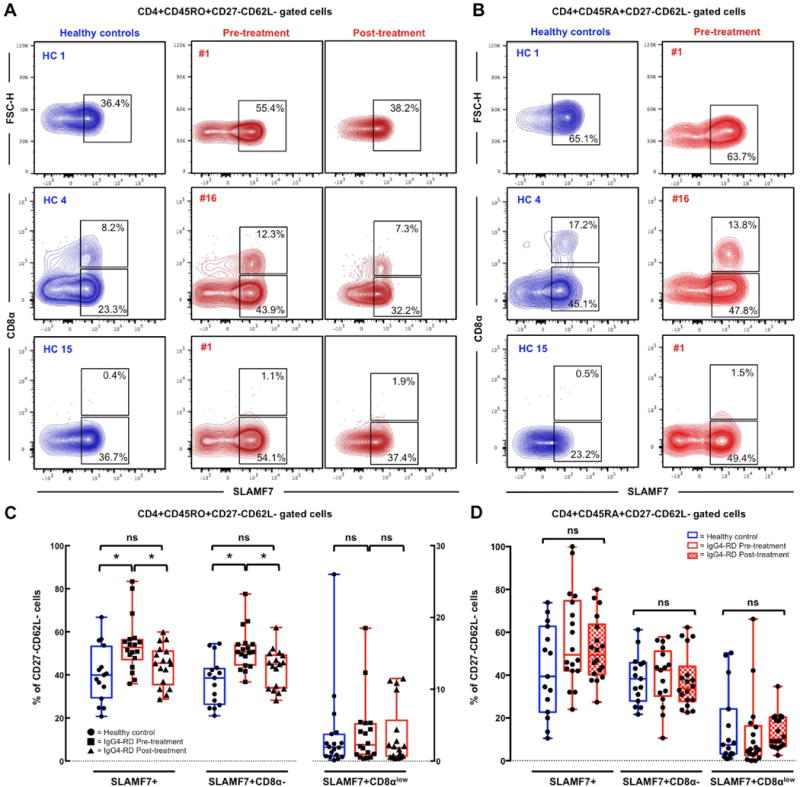
Contour plots showing different frequencies of CD8αlow and CD8α− SLAMF7+CD4+ TEM cells (A) and TEMRA cells (B) in the peripheral blood of representative healthy controls (HC 1, 4, and 15) and patients with IgG4-RD (#1 and 16) before and after glucocorticoid treatment. Box plots of CD8αlow and CD8α− SLAMF7+CD4+ TEM cells (C) and TEMRA cells (D) in the peripheral blood of healthy controls and patients with IgG4-RD displaying mean values and range. P values are based on the Mann-Whitney test. Asterisks indicate a p value < 0.05.