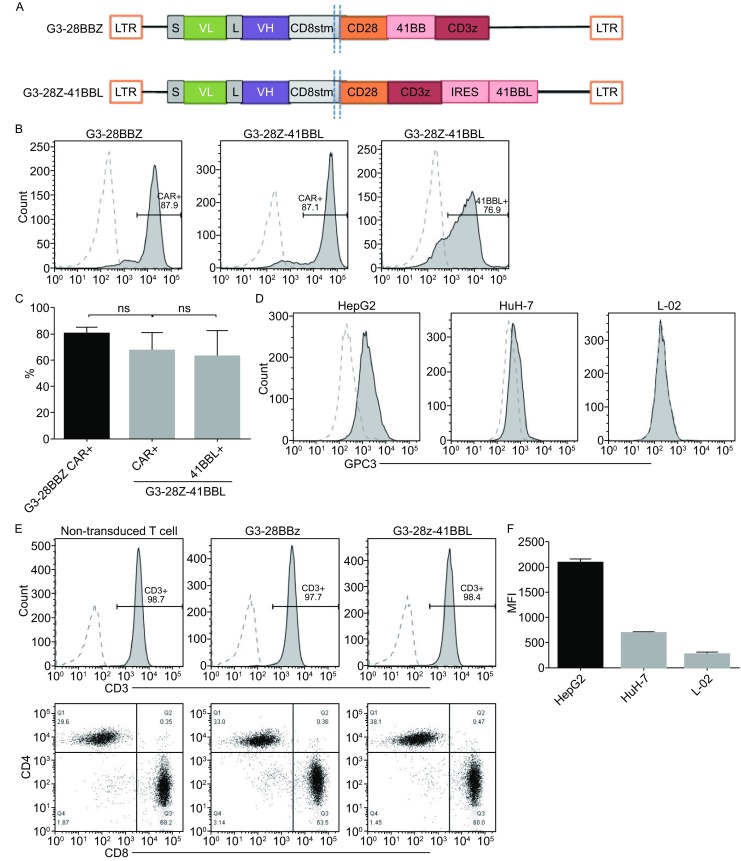
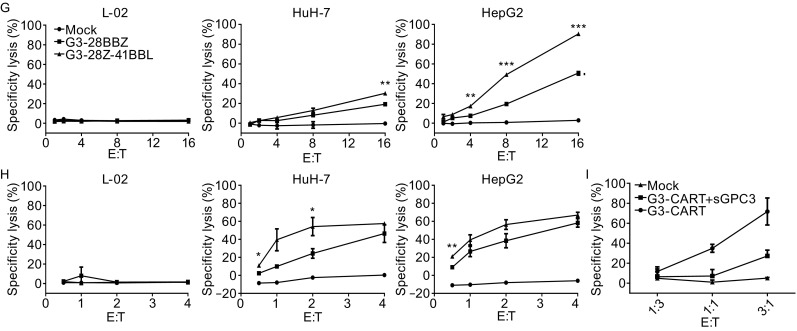
Figure 1.


Expression of GPC3-CAR on the surface of T cells and GPC3-CAR T cells recognize and kill GPC3-positive tumor cells. (A) Schematic map of CAR constructs. LTR, long terminal repeat; S, signal sequence of CD8; VL-L-VH, single chain variable regions of monoclonal anti-GPC3 antibody; CD8 stem, part of the extracellular region and all of the transmembrane of CD8; CD28, intracellular signaling domain of CD28; 41BB, intracellular signaling domain of 4-1BB; CD3z, the entire cytoplasmic region of the TCR-ζ molecule; IRES, internal ribosome entry site; 41BBL, entire 4-1BB ligand molecule. (B and C) GPC3-CAR expression on T cell surface determined by flow cytometry. One representative donor and summary data for three independent donors. Mock T cells served as controls. No difference was detected between the expression levels of GPC3 CARs or 4-1BB ligand (ANOVA); (D) Generated CAR-T cells profiling for CD3/CD8/CD4 ratio by flow cytometry; (E and F) Flow cytometry measured GPC3 expression on HepG2, HuH-7, and L-02 cells; (G and H) Tumor cell lysis was measured with LDH release assay at indicated effector to target ratios and coculture for 4 h (G) or 18 h (H) against GPC3-positive solid tumor cell lines HepG2, HuH-7, and GPC3-negative immortal hepatic cell line L-02; (I) Adding soluble recombinant GPC3 protein at 5 μg/mL inhibited the killing activity. Representative results from 3 independent experiments were showed. One-way ANOVA with Tukey’s test was used for comparative analysis, *P < 0.05; **P < 0.01; ***P < 0.001
