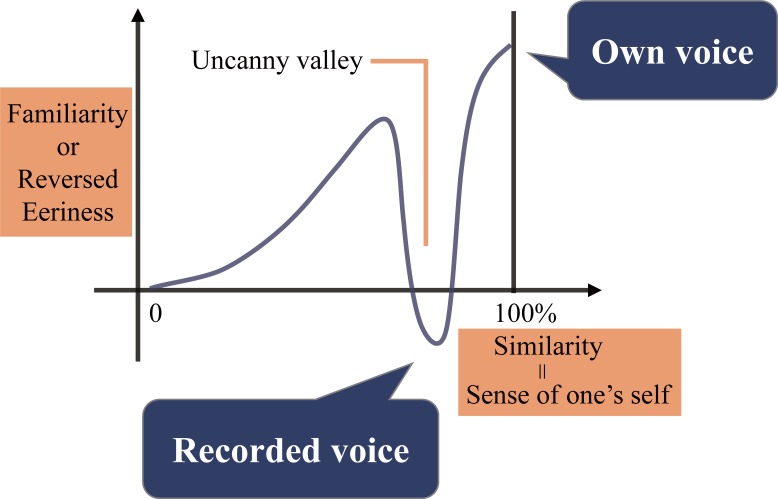
Fig 1. Conceptual diagram of the uncanny valley in the voice field.
Adapted from “The Uncanny Valley,” by M. Mori, 1970. Conceptual diagram of the theoretical graph presented in the original uncanny valley theory. X-axis corresponds to similarity between robots and humans and y-axis corresponds to familiarity of the robots. Recorded voice may represent the valley part and own voice the highest point after the valley. Sense of one’s self instead of similarity was used in the present study.

