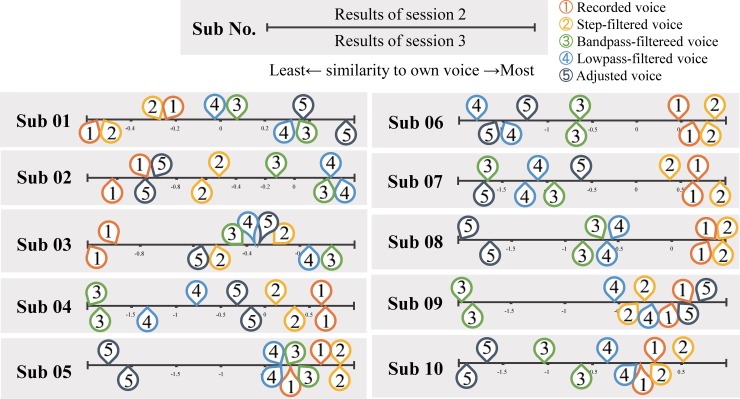
Fig 3. Experiment 1.
Individual results of pairwise comparison. The bar represents the similarity to own voice, rightmost represents the most own-voice like and leftmost represents the least own-voice like rating. The numbers on the top-half of the bar represents the result of the second session and the ones on bottom-half of the bar are the results of the third session. The numbers are for types of conditions: 1) Recorded voice, 2) Step filtered voice, 3) Bandpass filtered voice, 4) Lowpass filtered voice, 5) Adjusted voice.

