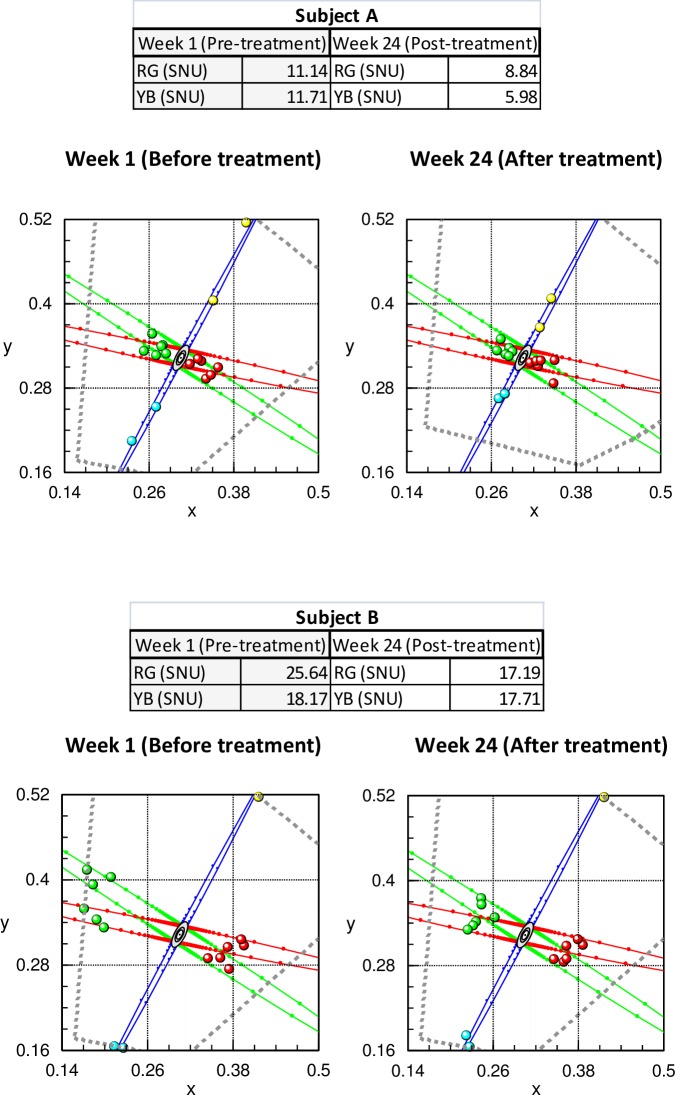
Fig 2.
CAD results before and after Ozurdex treatment in two subjects with diabetes (A- subject 11; B- subject 4). Both subjects show significant improvement in chromatic sensitivity (i.e., smaller thresholds) post treatment. The grey, dotted lines show the colour limits imposed by the phosphors of the display. Subject B was unable to detect YB colour changes, even for the largest chromatic signals that are limited only by the phosphors of the display with no improvement post treatment. The RG thresholds, on the other hand, show significant improvement post-treatment.

