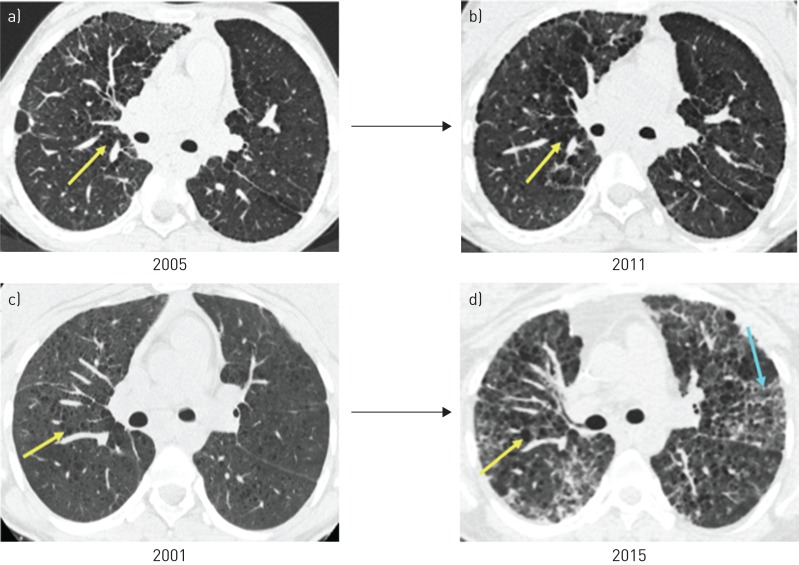
FIGURE 1.
Serial imaging while on immunosuppressive therapy (two subjects). Axial computed tomography images from subject 5 demonstrate radiographic stability (a) baseline and b) 6 years later) in contrast to subject 4, who developed more cysts and ground-glass opacities over time (c) baseline and d) 14 years later). Yellow arrows indicate cysts and blue arrows indicate ground-glass opacity.

