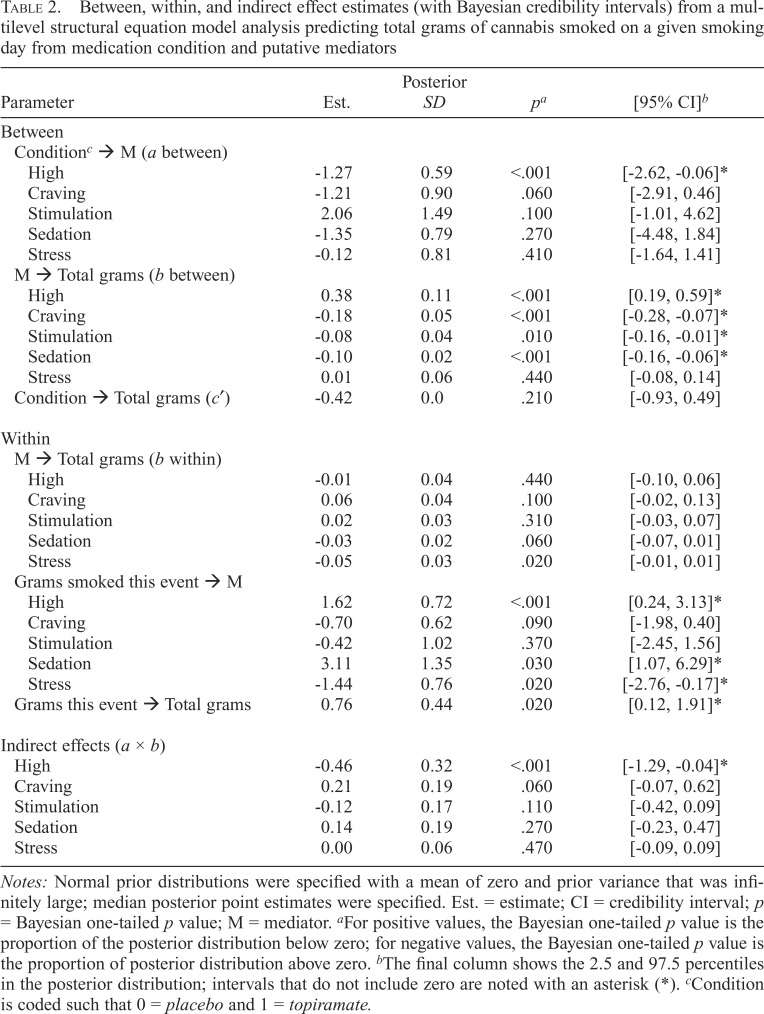
Table 2.
Between, within, and indirect effect estimates (with Bayesian credibility intervals) from a multilevel structural equation model analysis predicting total grams of cannabis smoked on a given smoking day from medication condition and putative mediators
| Parameter | Est. | Posterior SD | pa | [95% CI]b |
| Between | ||||
| Conditionc → M (a between) | ||||
| High | -1.27 | 0.59 | <.001 | [-2.62, -0.06]* |
| Craving | -1.21 | 0.90 | .060 | [-2.91, 0.46] |
| Stimulation | 2.06 | 1.49 | .100 | [-1.01, 4.62] |
| Sedation | -1.35 | 0.79 | .270 | [-4.48, 1.84] |
| Stress | -0.12 | 0.81 | .410 | [-1.64, 1.41] |
| M → Total grams (b between) | ||||
| High | 0.38 | 0.11 | <.001 | [0.19, 0.59]* |
| Craving | -0.18 | 0.05 | <.001 | [-0.28, -0.07]* |
| Stimulation | -0.08 | 0.04 | .010 | [-0.16, -0.01]* |
| Sedation | -0.10 | 0.02 | <.001 | [-0.16, -0.06]* |
| Stress | 0.01 | 0.06 | .440 | [-0.08, 0.14] |
| Condition → Total grams (c′) | -0.42 | 0.0 | .210 | [-0.93, 0.49] |
| Within | ||||
| M → Total grams (b within) | ||||
| High | -0.01 | 0.04 | .440 | [-0.10, 0.06] |
| Craving | 0.06 | 0.04 | .100 | [-0.02, 0.13] |
| Stimulation | 0.02 | 0.03 | .310 | [-0.03, 0.07] |
| Sedation | -0.03 | 0.02 | .060 | [-0.07, 0.01] |
| Stress | -0.05 | 0.03 | .020 | [-0.01, 0.01] |
| Grams smoked this event → M | ||||
| High | 1.62 | 0.72 | <.001 | [0.24, 3.13]* |
| Craving | -0.70 | 0.62 | .090 | [-1.98, 0.40] |
| Stimulation | -0.42 | 1.02 | .370 | [-2.45, 1.56] |
| Sedation | 3.11 | 1.35 | .030 | [1.07, 6.29]* |
| Stress | -1.44 | 0.76 | .020 | [-2.76, -0.17]* |
| Grams this event → Total grams | 0.76 | 0.44 | .020 | [0.12, 1.91]* |
| Indirect effects (a × b) | ||||
| High | -0.46 | 0.32 | <.001 | [-1.29, -0.04]* |
| Craving | 0.21 | 0.19 | .060 | [-0.07, 0.62] |
| Stimulation | -0.12 | 0.17 | .110 | [-0.42, 0.09] |
| Sedation | 0.14 | 0.19 | .270 | [-0.23, 0.47] |
| Stress | 0.00 | 0.06 | .470 | [-0.09, 0.09] |
Notes: Normal prior distributions were specified with a mean of zero and prior variance that was infinitely large; median posterior point estimates were specified. Est. = estimate; CI = credibility interval; p = Bayesian one-tailed p value; M = mediator. aFor positive values, the Bayesian one-tailed p value is the proportion of the posterior distribution below zero; for negative values, the Bayesian one-tailed p value is the proportion of posterior distribution above zero. bThe final column shows the 2.5 and 97.5 percentiles in the posterior distribution; intervals that do not include zero are noted with an asterisk (*). cCondition is coded such that 0 = placebo and 1 = topiramate.

