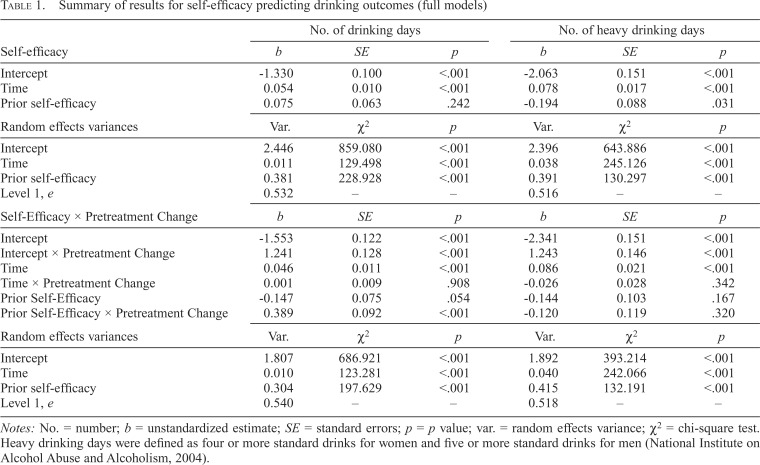
Table 1.
Summary of results for self-efficacy predicting drinking outcomes (full models)
| Self-efficacy | No. of drinking days |
No. of heavy drinking days |
||||
| b | SE | p | b | SE | p | |
| Intercept | -1.330 | 0.100 | <.001 | -2.063 | 0.151 | <.001 |
| Time | 0.054 | 0.010 | <.001 | 0.078 | 0.017 | <.001 |
| Prior self-efficacy | 0.075 | 0.063 | .242 | -0.194 | 0.088 | .031 |
| Random effects variances | Var. | χ2 | p | Var. | χ2 | p |
| Intercept | 2.446 | 859.080 | <.001 | 2.396 | 643.886 | <.001 |
| Time | 0.011 | 129.498 | <.001 | 0.038 | 245.126 | <.001 |
| Prior self-efficacy | 0.381 | 228.928 | <.001 | 0.391 | 130.297 | <.001 |
| Level 1, e | 0.532 | – | – | 0.516 | – | – |
| Self-Efficacy × Pretreatment Change | b | SE | p | b | SE | p |
| Intercept | -1.553 | 0.122 | <.001 | -2.341 | 0.151 | <.001 |
| Intercept × Pretreatment Change | 1.241 | 0.128 | <.001 | 1.243 | 0.146 | <.001 |
| Time | 0.046 | 0.011 | <.001 | 0.086 | 0.021 | <.001 |
| Time × Pretreatment Change | 0.001 | 0.009 | .908 | -0.026 | 0.028 | .342 |
| Prior Self-Efficacy | -0.147 | 0.075 | .054 | -0.144 | 0.103 | .167 |
| Prior Self-Efficacy × Pretreatment Change | 0.389 | 0.092 | <.001 | -0.120 | 0.119 | .320 |
| Random effects variances | Var. | χ2 | p | Var. | χ2 | p |
| Intercept | 1.807 | 686.921 | <.001 | 1.892 | 393.214 | <.001 |
| Time | 0.010 | 123.281 | <.001 | 0.040 | 242.066 | <.001 |
| Prior self-efficacy | 0.304 | 197.629 | <.001 | 0.415 | 132.191 | <.001 |
| Level 1, e | 0.540 | – | – | 0.518 | – | – |
Notes: No. = number; b = unstandardized estimate; SE = standard errors; p = p value; var. = random effects variance; χ2 = chi-square test. Heavy drinking days were defined as four or more standard drinks for women and five or more standard drinks for men (National Institute on Alcohol Abuse and Alcoholism, 2004).

