Table 1.
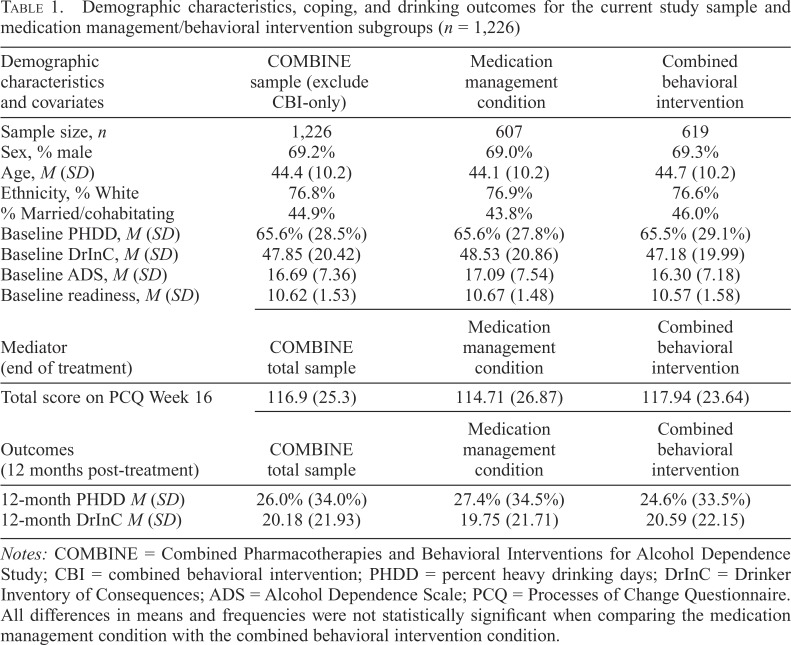
Demographic characteristics, coping, and drinking outcomes for the current study sample and medication management/behavioral intervention subgroups (n = 1,226)
| Demographic characteristics and covariates | COMBINE sample (exclude CBI-only) | Medication management condition | Combined behavioral intervention |
| Sample size, n | 1,226 | 607 | 619 |
| Sex, % male | 69.2% | 69.0% | 69.3% |
| Age, M (SD) | 44.4 (10.2) | 44.1 (10.2) | 44.7 (10.2) |
| Ethnicity, % White | 76.8% | 76.9% | 76.6% |
| % Married/cohabitating | 44.9% | 43.8% | 46.0% |
| Baseline PHDD, M (SD) | 65.6% (28.5%) | 65.6% (27.8%) | 65.5% (29.1%) |
| Baseline DrInC, M (SD) | 47.85 (20.42) | 48.53 (20.86) | 47.18 (19.99) |
| Baseline ADS, M (SD) | 16.69 (7.36) | 17.09 (7.54) | 16.30 (7.18) |
| Baseline readiness, M (SD) | 10.62 (1.53) | 10.67 (1.48) | 10.57 (1.58) |
| Mediator (end of treatment) | COMBINE total sample | Medication management condition | Combined behavioral intervention |
| Total score on PCQ Week 16 | 116.9 (25.3) | 114.71 (26.87) | 117.94 (23.64) |
| Outcomes (12 months post-treatment) | COMBINE total sample | Medication management condition | Combined behavioral intervention |
| 12-month PHDD M (SD) | 26.0% (34.0%) | 27.4% (34.5%) | 24.6% (33.5%) |
| 12-month DrInC M (SD) | 20.18 (21.93) | 19.75 (21.71) | 20.59 (22.15) |
Notes: COMBINE = Combined Pharmacotherapies and Behavioral Interventions for Alcohol Dependence Study; CBI = combined behavioral intervention; PHDD = percent heavy drinking days; DrInC = Drinker Inventory of Consequences; ADS = Alcohol Dependence Scale; PCQ = Processes of Change Questionnaire. All differences in means and frequencies were not statistically significant when comparing the medication management condition with the combined behavioral intervention condition.

