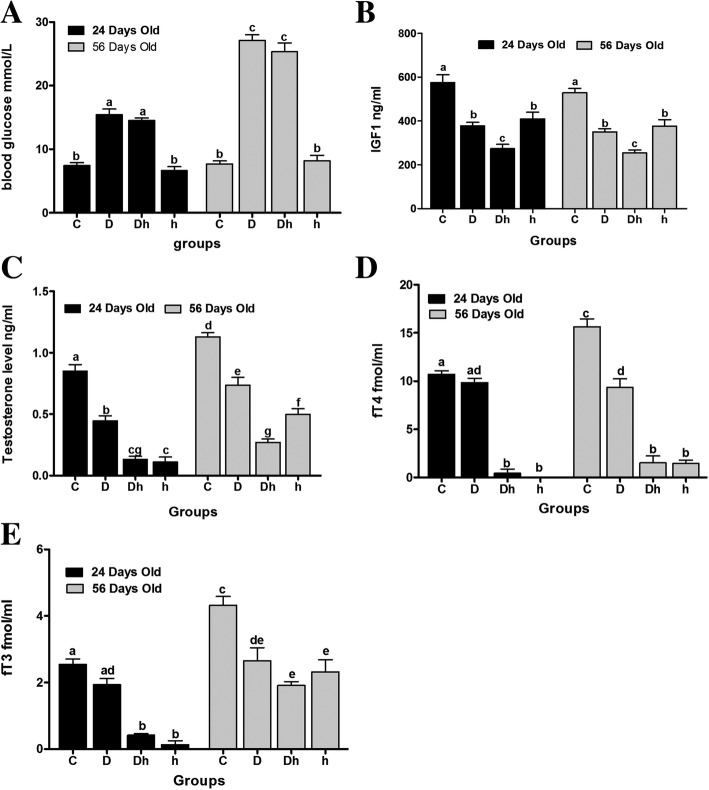
Fig. 1.
The blood glucose levels and concentrations of different measured hormones under the influence of diabetes mellitus and hypothyroidism. (A) Blood Glucose level, (B) IGF-1, (C) testosterone, (D) fT4 and (E) fT3. Data are represented as mean ± SEM (n = 6), and different labels indicated significant differences among groups at P < 0.05. Abbreviations: Control (C), Diabetic (D), diabetic + hypothyroidism (Dh) and Hypothyroidism (h)

