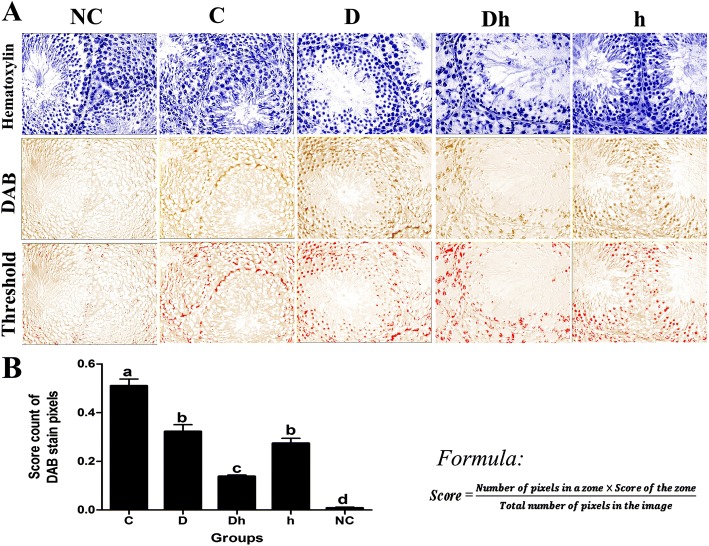
Fig. 6.
Representative digital images of histogram profile shows DAB brown staining, color pixel intensity for Claudin-11 in the testes of adult mice, exposed to experimental diabetes mellitus and hypothyroidism. (A) From top to bottom rows; panels shows the digital image masks stained with hematoxylin, DAB and threshold respectively. (B) Claudin-11 is expressed in a limited quantity at tight junction in between Sertoli cells of all treated groups that is why analyzed through score calculation. Data are representing mean ± SEM (n = 6) and different labels indicated significant differences among groups at P < 0.05

