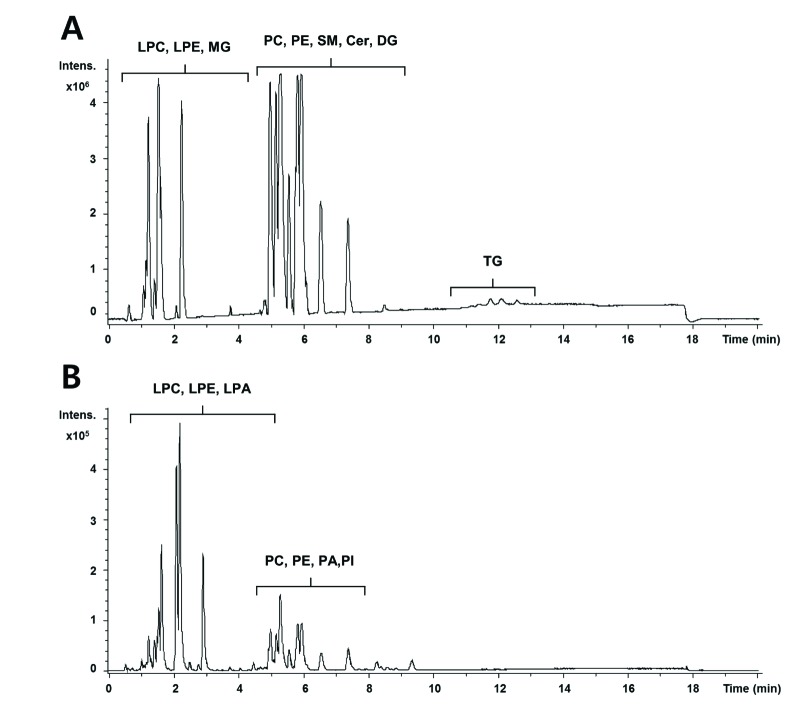
Fig. 1. UPLC/Q-TOF MS spectra of serum lipid extracts in positive and negative mode.
The base peak intensity (BPI) chromatograms obtained from an analysis in positive (A) and negative (B) ionization mode are shown. LC-MS was performed on a quadruple time-of-flight MS/MS system combined with a UPLC system.

