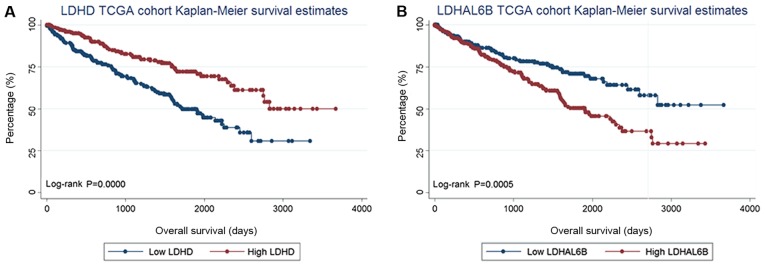
Figure 1.
Kaplan-Meier plots of survival in the TCGA cohort are presented according to LDHD and LDHAL6B expression. (A) Kaplan-Meier estimates of OS are presented according to the expression of LDHD. (B) Kaplan-Meier estimates of OS are presented according to the expression of LDHAL6B. TCGA, The Cancer Genome Atlas; LDH, lactate dehydrogenase; LDHAL6B, LDH A like 6B; OS, overall survival.

