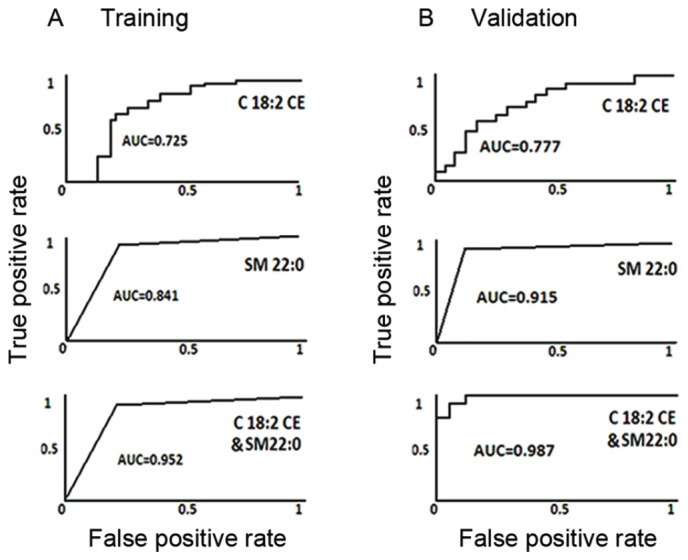
Figure 2.

AUC values of C18:2 CE and SM 22:0 for SqCC prediction in the training and validation cohorts. The AUC values in SqCC prediction for C18:2 CE (top), SM 22:0 (middle) and the 2 combined lipid markers (bottom) in the (A) training and (B) validation samples. AUC, area under the curve; CE, cholesterol esters; SM, sphingomyelin; SqCC, squamous cell lung cancer.
