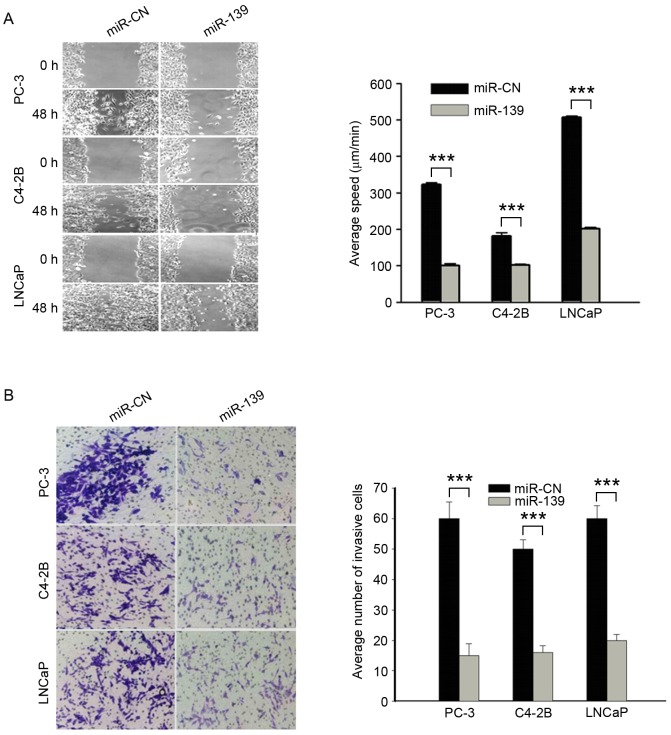
Figure 3.
Cell migration and invasiveness of prostate cancer cells transfected with miR-CN or miR-139. (A) Light microscope image of cell migration and mean cell migration speed distribution in PC-3, C4-2B and LNCaP cells. Representative images are shown at ×100 magnification. (B) Light microscope image of cell invasiveness and mean number of invasive cells per field in PC-3, C4-2B and LNCaP cells. Representative images are shown at 100× magnification. ***P<0.001 vs. miR-CN. miR, microRNA; CN, negative control.

