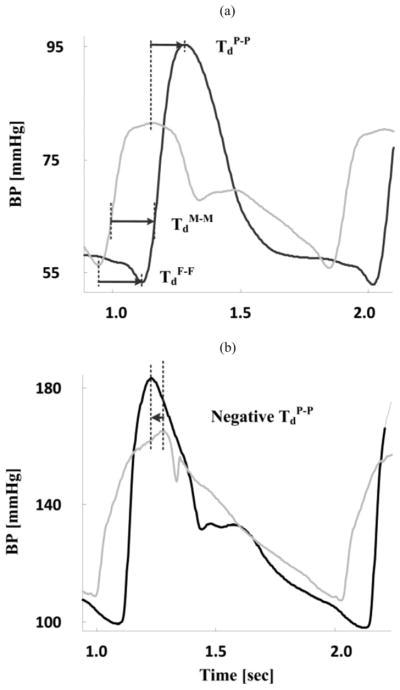
Fig. 1.
Naïve technique for estimation of multiple PTT values at different BP levels in the cardiac cycle from proximal (gray) and distal (black) BP waveforms. (a) PTT at diastolic, mean, and systolic BP (DP, MP, and SP) levels are detected as the foot-to-foot (TdF-F), mean-to-mean (TdM-M), and peak-to-peak (TdP-P) time delays, respectively. TdM-M is specifically determined by identifying the times in the systolic upstrokes of the waveforms that correspond to the MP level and then taking the difference between these times. (b) Peak-to-peak time delay is often not useful. The proximal and distal BP waveforms here were obtained with micromanometer-tipped catheters in the ascending aorta and femoral artery of swine.

