
Figure 1.
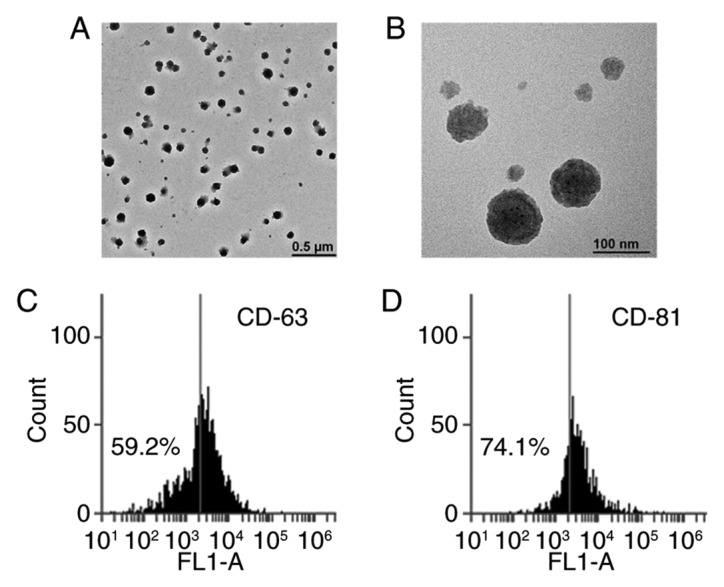
Transmission electron microscopy and flow cytometry analysis was used to examine EVs isolated from the plasma using a spin column membrane. Representative images captured by transmission electron microscopy revealed the diameters of EVs were ~100 nm. (A) and (B) depict the same sample at different magnifications. Scale bar: (A) 0.5 µm and (B) 100 nm. The exosome-specific markers (C) CD63 and (D) CD81 were detected using flow cytometry analysis. CD63, cluster of differentiation 63; FL1-A, FL1 area; EVs, extracellular vesicles.