Figure 2.

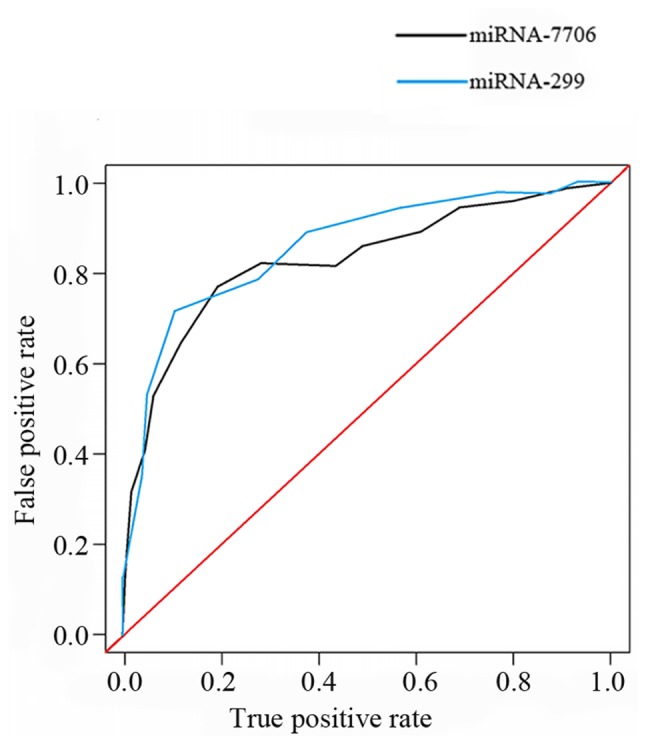
ROC curve analysis of the diagnostic values of miRNA-299 and miRNA-7706 for HCC. The areas under the curve of miRNA-299 and miRNA-7706 were 0.804 and 0.781, respectively. HCC, hepatocellular carcinoma.

ROC curve analysis of the diagnostic values of miRNA-299 and miRNA-7706 for HCC. The areas under the curve of miRNA-299 and miRNA-7706 were 0.804 and 0.781, respectively. HCC, hepatocellular carcinoma.