Figure 3.
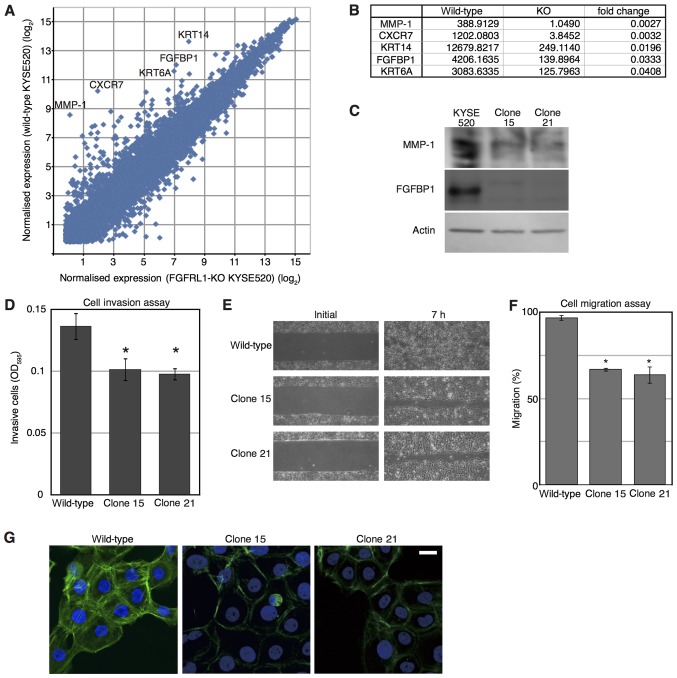
Microarray analysis of FGFRL1-deficient cells. (A) Identification of transcripts differentially expressed in wild-type and FGFRL1-deficient cells. Mean of expression levels in parental KYSE520 cells and the clone 1, and those in clones 15 and 21, were plotted as ‘wild-type KYSE520’ and ‘FGFRL1-KO KYSE520’, respectively. Each dot represents an individual gene. Transcripts markedly downregulated in KYSE520-deficient cells are denoted by their gene symbol. (B) Genes exhibiting notably decreased expression in FGFRL1-deficient cells. (C) Western blot analysis of cell extracts prepared from the indicated cells. (D) Cell invasion through a porous type-I collagen membrane. After 24 h, invaded cells were stained with a blue dye and permeabilised in 200 µl of buffer. The experiment was repeated three times. Data represent the mean values. Error bars indicate the standard error of the mean. *P<0.05 (Dunnett's test) vs. the wild-type. (E) Cell migration assay. (F) The invaded area presented in (E) was assessed. The experiment was repeated three times. The data in the graph are expressed as mean values. Error bars indicate the standard error of the mean. *P<0.05 (Dunnett's test) vs. the wild-type. (G) Phalloidin staining of cell lines. Scale bar, 10 µm. FGFRL1, fibroblast growth factor receptor-like 1; OD, optical density; MMP, matrix metalloproteinase; CXCR7, C-X-C chemokine receptor type 7; KRT14, keratin 14; FGFBP1, fibroblast growth factor binding protein 1; KRT6A, keratin 6A.

