Fig. 2.

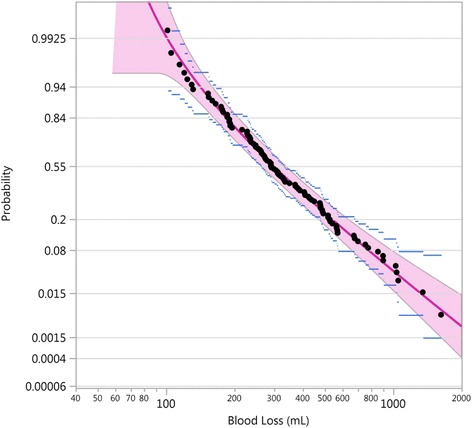
Probabilistic plot of the THLN fitted curve (red line) with pointwise 95% confidence band (red area), showing the data points (black dots) with their 95% confidence intervals (blue lines), Althabe et al. trial, hands-off treatment [1]

Probabilistic plot of the THLN fitted curve (red line) with pointwise 95% confidence band (red area), showing the data points (black dots) with their 95% confidence intervals (blue lines), Althabe et al. trial, hands-off treatment [1]