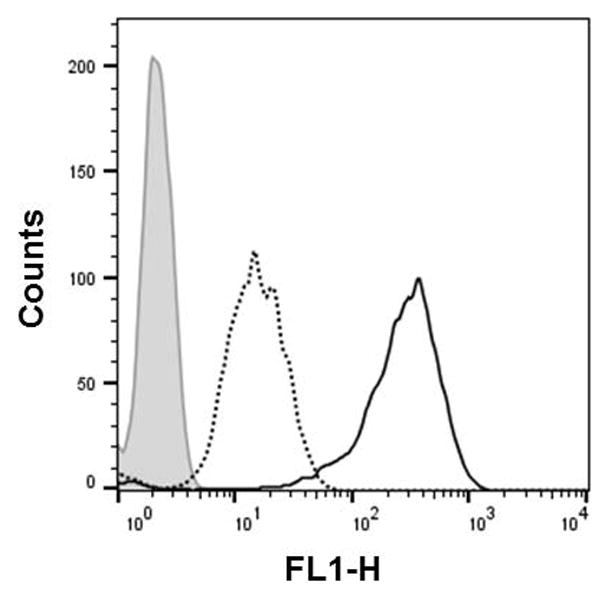
Figure 4.xx.14.

Flow cytometry analysis of the 2′-OMeUtaPS-mediated internalization of PMO sequence 5 (peak area with a solid black border) in the presence of urea (peak area with a dotted black border) in HeLa pLuc 705 cells. Pale gray peak area accounts for untreated HeLa pLuc 705 cells. The concentration of 5 and 2′-OMeUtaPS is 1.0 μM and 2.0 μM, respectively, while the concentration of urea is 2.0 M during the course of PMO sequence 5:2′-OMeUtaPS complex formation.
