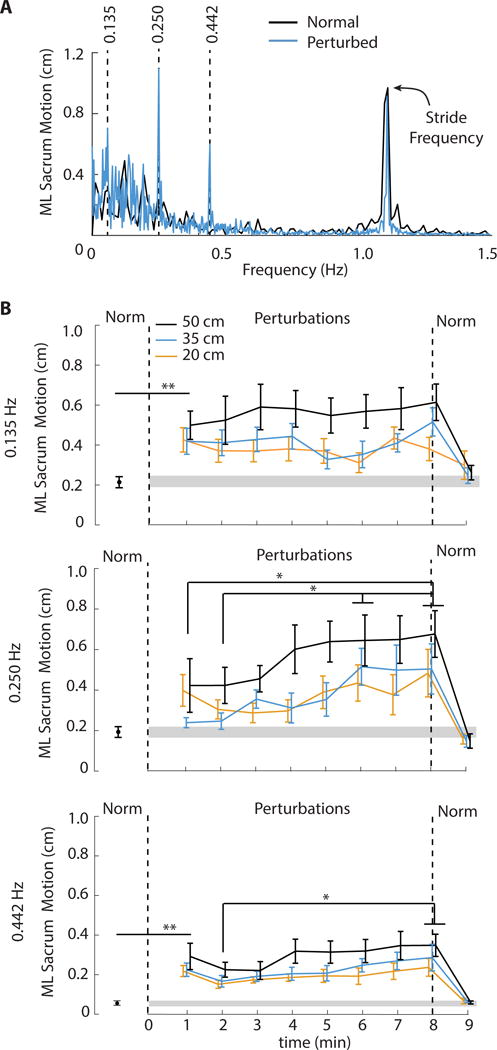
Figure 3.

(A) Group-average (standard error) spectrum of ML sacrum motion reveals distinct peaks of signal intensity at, and thus naturally emerging entrainment to, each of the three perturbation frequencies (0.135, 0.250 and 0.442 Hz). (B) Mean (standard error) peak mediolateral (ML) sacrum motion at each perturbation frequency as a functional of perturbation amplitude and time compared to normal, unperturbed walking (“Norm”). Gray shading represents plus and minus one standard error of each measure during normal walking. Vertical dashed lines represent cessation of optical flow perturbations and a return to normal, unperturbed walking. Double asterisks (**) indicate significantly different from normal walking for the onset of visual perturbations and/or following their cessation (p<0.05). Single asterisks (*) indicate significant post-hoc differences between the identified time points (p<0.05).
