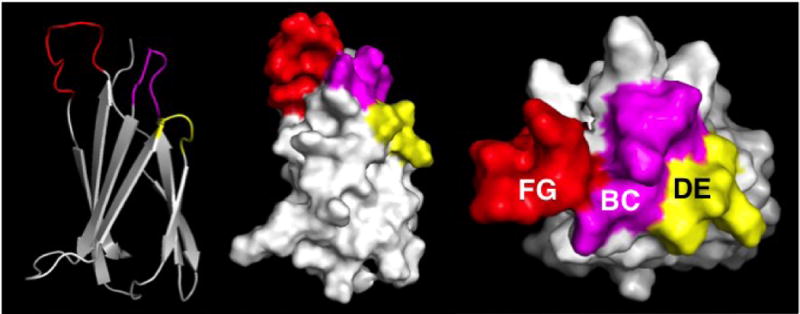
Figure 1. PyMol representations of the FN3 monobody.

Left: cartoon, with β-sheets and loops (color). Middle: surface representation. Right: surface representation, viewed from the top. Red, purple, and yellow correspond to FG, BC, and DE loops that have been randomized.
