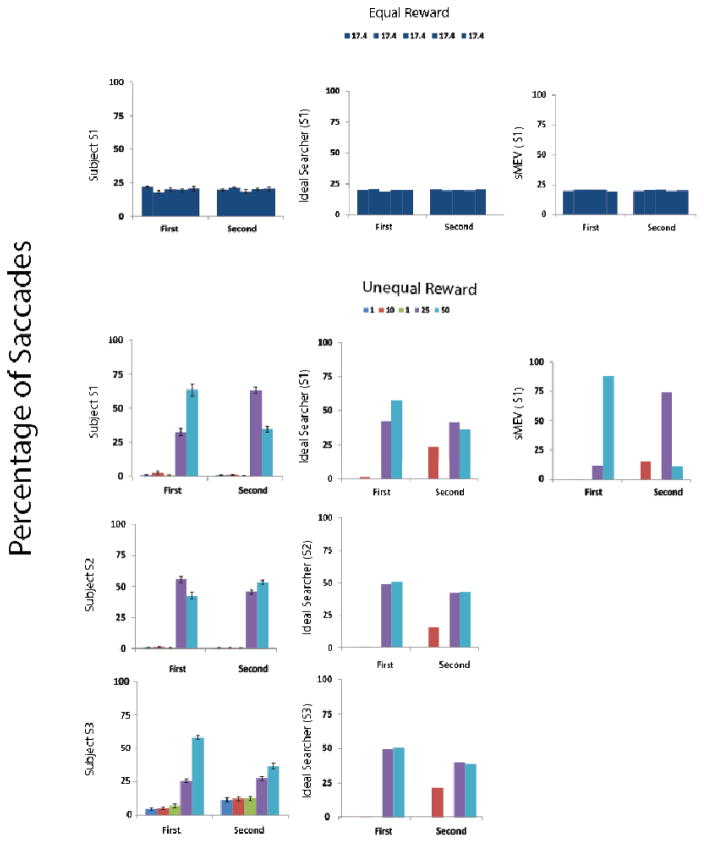
Figure 3.
The y-axis of each graph corresponds to percentage of saccades (first and second eye movements) directed to each of the locations for equal and unequal reward locations. Equal reward results are shown for Subject 1 (additional subjects are shown in the Appendix). Unequal reward results are shown for each subject, for the ideal reward searcher (IS) using the visibility map of each observer and the sMEV model for subject 1 (sMEV model predictions for the other two observers are similar to those of observer 1 and are included in the Appendix B). Error bars for human observers are standard errors of the mean across sessions. Legends provide the reward for each location indicated by black cues (equal reward cues) or color cues (unequal reward condition).

