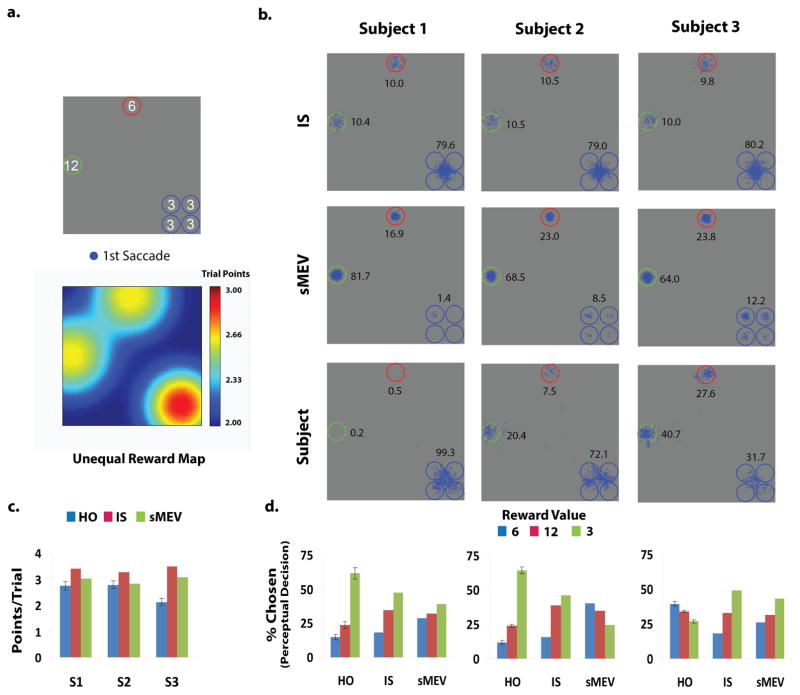
Figure 5.
a. Top: Configuration of locations containing the target and distractors and assigned reward points for correctly finding the target at each location. Display varied randomly across four rotations. Below: Reward map for the Ideal Reward Searcher for the configuration shown above. b. First saccade endpoints (blue) for each observer and his/her associated model (IS and sMEV) predictions. Numbers correspond to percentages of 1st saccades to each location (frequency for the four clustered locations were combined into a single number). Standard errors for these percentages ranged from 2.0 % to 4.0 % for the two high reward locations and from 0.65 to 6.0 % for the four clustered locations with low rewards. c. Points/trial for observers and models (IS and sMEV). d. Percentage of trials in which a location was selected in the perceptual decision (% chosen) for human observers and models.

