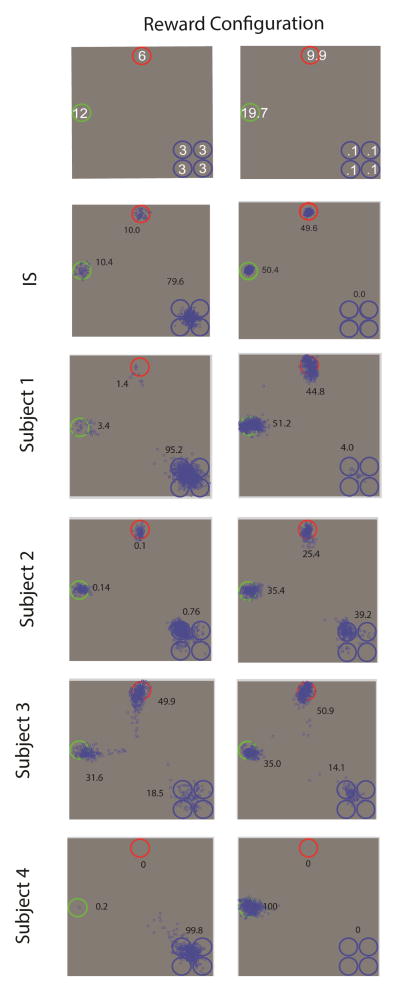
Figure 6.
Top: Configuration of locations containing the target and distractors and assigned reward points for correctly finding the target at each location for the two conditions in experiment 3. Cues were randomly rotated across four rotations. First saccade endpoints (blue) for each subject and the IS model predictions. Numbers correspond to percentages of 1st saccades to each location (frequency for the four clustered locations were combined into a single number). Standard errors for these percentages ranged from 0.4 % to 2.9 % for the two high reward locations and from 1.2 to 3.8 % for the four clustered locations with low rewards.

