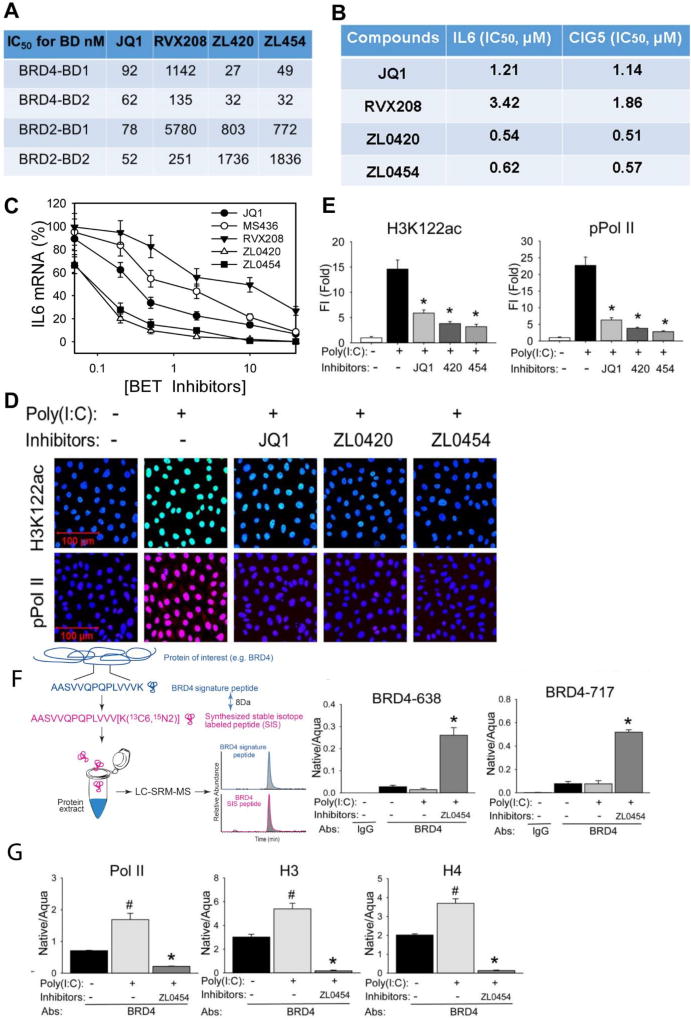
Figure 6. ZL lead compounds are potent and highly specific BRD4 inhibitors.
(A). Specificity of BRD4 inhibitors to BRD4 BDs was determined using TR-FRET assays. Data shown as the IC50 values of tested BRD4 inhibitors to the BRD2 and BRD4 BDs separately. (B). IC50 values of ZL lead compounds. hSAECs were pretreated with indicated series of BRD4 inhibitors from 0.01 nM to 100 µM final concentrations overnight prior to poly(I:C) stimulation (10 µg/ml for 4 h). The IC50 values of each inhibitor were estimated by poly(I:C) induced expression of innate immune genes IL6 and CIG5. (C). BRD4 inhibitors block IL6 expression. Shown as % inhibition of JQ1, MS436, RVX208, ZL0420, and ZL0454 inhibitors on poly(I:C)-induced IL6 expression. The results are from three independent experiments (n=3). (D) hSAECs were preincubated with ZL0420, ZL0454, and JQ1 overnight respectively before poly(I:C) stimulation. After fixation, cells were stained with anti-H3K122ac and phospho-Ser 2 CTD RNA Pol II Abs. (E). Quantifications of total fluorescence intensities on images of immunostaining of H3K122ac and phospho-Ser 2 CTDRNA Pol II in hSAECs. * p<0.01, n = 5. (F). Left, schematic diagram of the IP-SID-SRM-MS assay. Stable isotope labelled internal control peptides are used to quantify target proteins in a triple quadrupole MS. Right, SID-SRM-MS assay for two BRD4 peptides (BRD4-638 peptide and 717 peptide). (G). IP-SID-SRM-MS for BRD4 associated Pol II, H3, and H4 proteins were normalized by the input protein concentration and presented as native/aqua values. *: p < 0.01 compared to poly(I:C) only and #: p < 0.01 compared to mock treatment, n=3.

