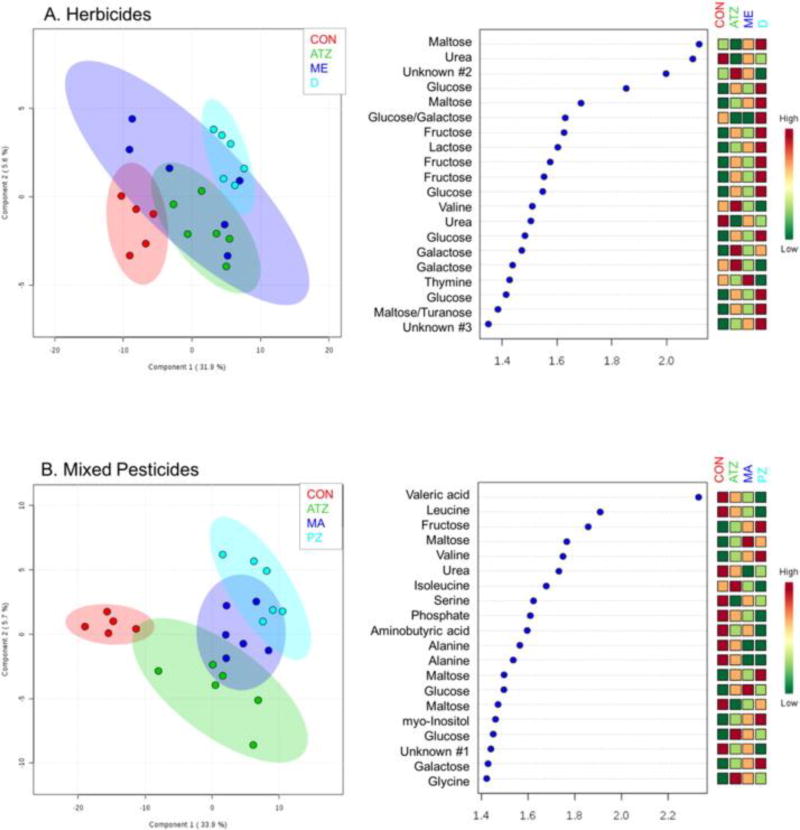
Fig. 2.
PLS-DA scores plot (left) and VIP scores from principal component 2 of the PLS-DA (right) for the herbicide exposure model (A) and mixed pesticide exposure model (B) identifying the top 25 GC/MS features responsible for separation between treatment classes (x-axis is the correlation score generated by Metaboanalyst®).

