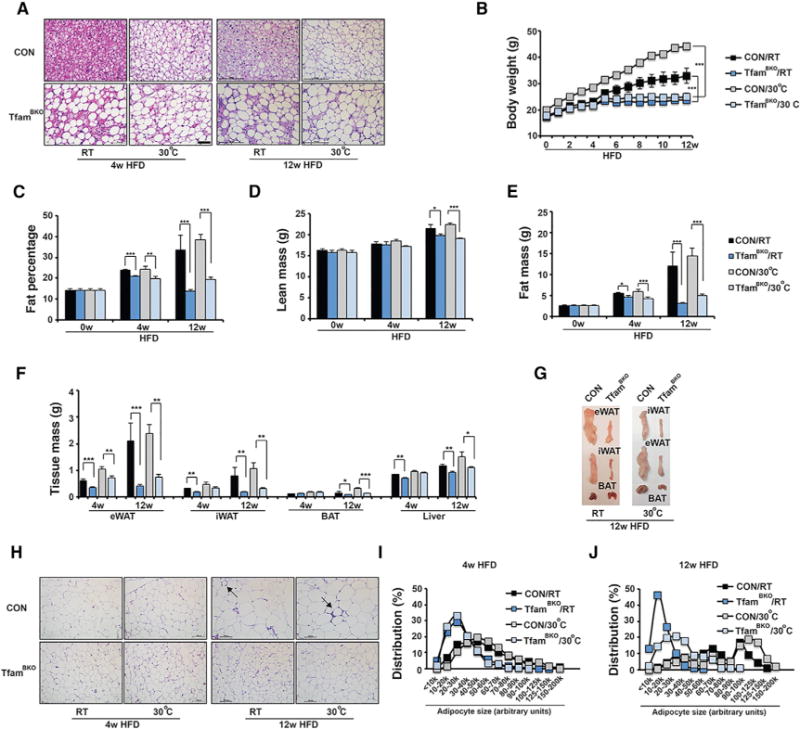
Figure 5. TfamBKO Mice Show Reduced Adiposity under HFD at RT and Thermoneutrality.

(A) Representative H&E staining of BAT from male CON and TfamBKO mice after 4- and 12-week HFD at both RT and 30°C. Scale bar, 50 μm.
(B) Body weight of male CON and TfamBKO mice under HFD at RT and 30°C. Sample size: CON/RT (n = 7), TfamBKO/RT (n = 13), CON/30°C (n = 3), and TfamBKO/30°C (n = 5).
(C–E) Fat percentage (C), lean mass (D), and fat mass (E) of male CON and TfamBKO mice under HFD at RT and 30°C. Sample size: CON/0w/RT (n = 7), TfamBKO/0w/RT (n = 6), CON/4w/RT (n = 4), TfamBKO/4w/RT (n = 4), CON/4w/30°C (n = 7), TfamBKO/4w/30°C (n = 9), CON/12w/RT (n = 4), TfamBKO/12w/RT (n = 7), CON/12w/30°C (n = 7). and TfamBKO/12w/30°C (n = 13).
(F) Tissue mass of eWAT, iWAT, BAT, and liver of male CON and TfamBKO mice after 4 and 12-week HFD at both RT and 30°C. Sample size: CON/4w/RT (n = 4), TfamBKO/4w/RT (n = 4), CON/4w/30°C (n = 5), TfamBKO/4w/30 C (n = 3), CON/12w/RT (n = 4), TfamBKO/12w/RT (n = 8), CON/12w/30°C (n = 5), and TfamBKO/12w/30°C (n = 9).
(G) Representative images of dissected iWAT, eWAT, and BAT from CON and TfamBKO mice after 12-week HFD at RT and 30°C.
(H–J) Representative H&E staining (H) of eWAT from male CON and TfamBKO mice after 4- and 12-week HFD at both RT and 30°C. Scale bar, 100 μm. Arrows indicate crown-like structures. Adipocyte size distribution in eWAT from CON and TfamBKO mice after 4- and 12-week HFD at RT (I) and 30°C (J). Total adipocytes counted: CON/4w/RT (n = 593), TfamBKO/4w/RT (n = 1,031), CON/4w/30 C (n = 495), TfamBKO/4w/30°C (n = 552), CON/12w/RT (n = 224), TfamBKO/12w/RT (n = 692), CON/12w/30°C (n = 280), and TfamBKO/12w/30°C (n = 267).
Data are means and error bars are ±SEM. Student t test, *p < 0.1, **p < 0.05, and ***p < 0.01.
