
Figure 2. Live single-cell cytotoxicity for visualization and measurement of target cell killing by NK cells.
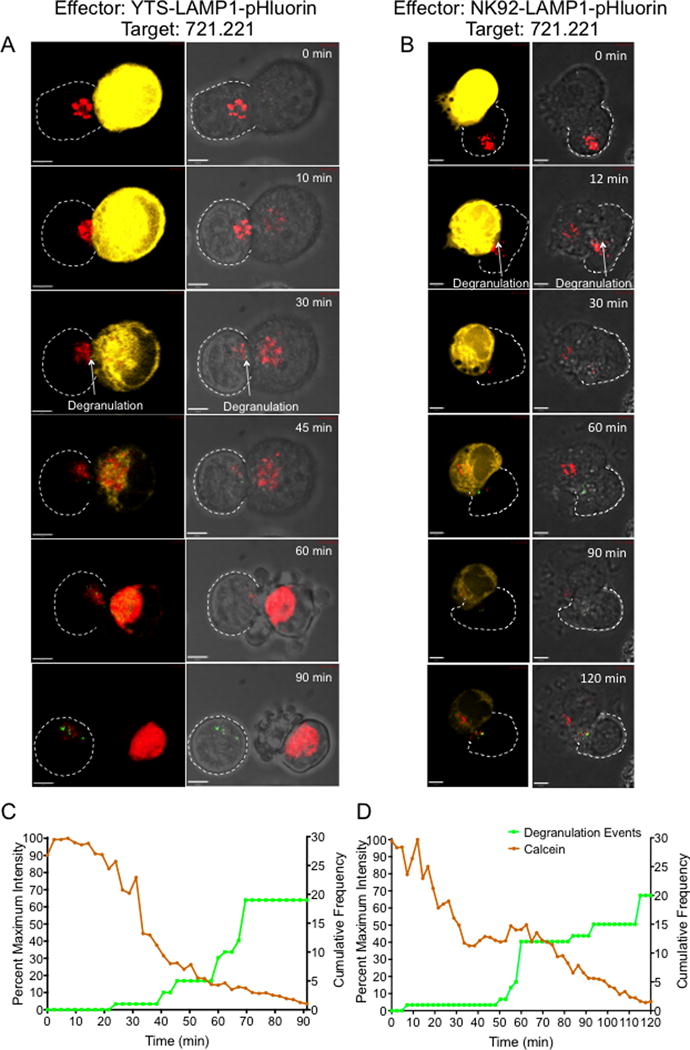
LAMP1-pHluorin transduced YTS and NK92 (effector) cells were loaded with LysoTracker Deep Red (red) and incubated with calcein, AM orange-red labeled 721.221 target cells (yellow). Z-stack images of single cell conjugates were acquired by confocal microscopy. Even though the 721.221 target cells were not stained with LysoTracker™ Deep Red, the excess dye from effector cells that leaked in to the medium was taken up by the target cell and the accumulation in the target cell increased once the membrane integrity was lost. Imaging was performed at a frame rate of 1 image every 2.4 minutes for 90 to 120 minutes until target cell death was observed. Representative maximum projection time-lapse image sequences of a single YTS cell (A) and a NK92 cell (B) conjugated to a single 721.221 target cell. Left panel shows calcein fluorescence (yellow) and degranulation events (green) at the NK-target cell synapse. Right panels show bright field images of the conjugates showing degranulation events (green) and characteristic apoptotic membrane blebbing in the target cell. The synaptic region of interest were selected as the overlapping region between the NK and the target cell identified in bright field images. Scale bar 5μm. (C and D) Quantitative analysis of degranulation and calcein fluorescence in the representative YTS-721.221 conjugate (C) and NK92-721.221 conjugate (D). Cumulative frequency of degranulation events in the effector cells and the fluorescence intensity of calcein in the target cell (calculated as a percent of maximum fluorescence intensity) were plotted against imaging time. Images and analyses are representative of 10-15 independent experiments.