
Figure 1.
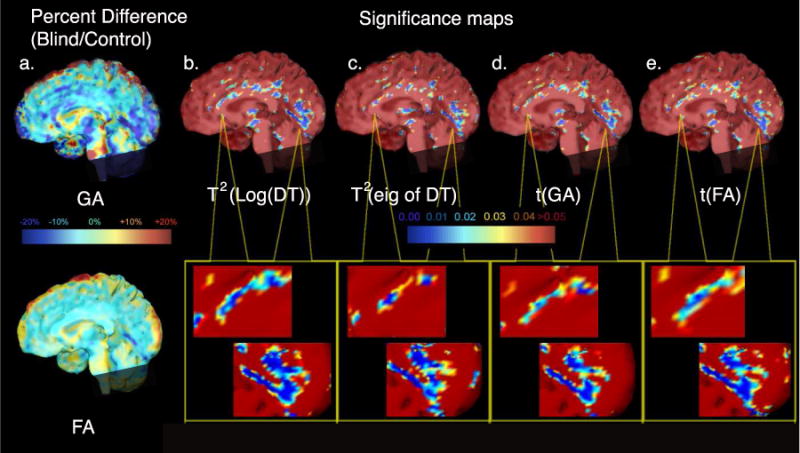
The first column (a) shows ratio maps indicating percent differences in mean GA and FA between groups of blind and sighted subjects. Group differences are indicated as a percentage difference relative to the control group mean at each voxel. Maps (b)–(e) show nonparametric-permutation based p-values derived at each image voxel for the Hotelling’s T2 statistic on the matrix logarithm of the full diffusion tensor, for a Hotelling’s T2 statistic computed on its 3 eigenvalues, treated as a 3-vector, and for a t statistic computed from log (GA) and log(FA). All maps show diffuse differences (largely reductions in diffusion anisotropy) between the blind and control subjects, using different locally derived measures of diffusion.