
Figure 2.
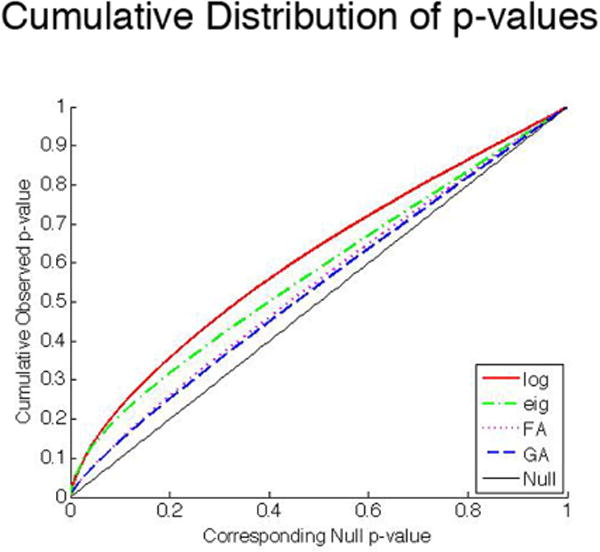
Cumulative distribution plots of p-values. Each graph shows a cumulative distribution function (CDF) plot for the scalar and multivariate statistics and compares them with the null distribution (represented by a solid diagonal line).
Official websites use .gov
A
.gov website belongs to an official
government organization in the United States.
Secure .gov websites use HTTPS
A lock (
) or https:// means you've safely
connected to the .gov website. Share sensitive
information only on official, secure websites.
Cumulative distribution plots of p-values. Each graph shows a cumulative distribution function (CDF) plot for the scalar and multivariate statistics and compares them with the null distribution (represented by a solid diagonal line).