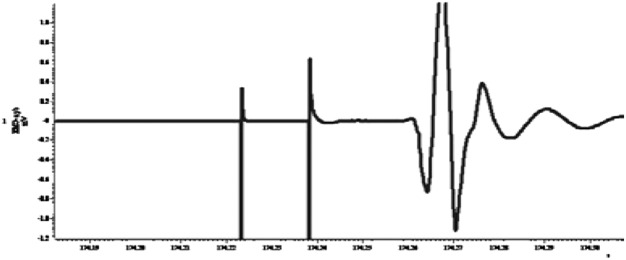
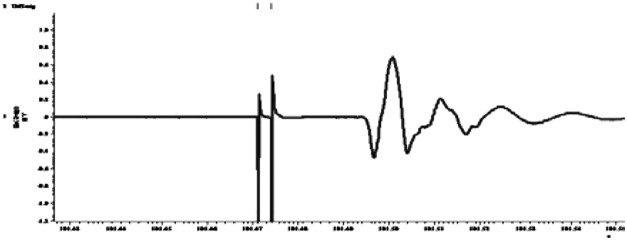
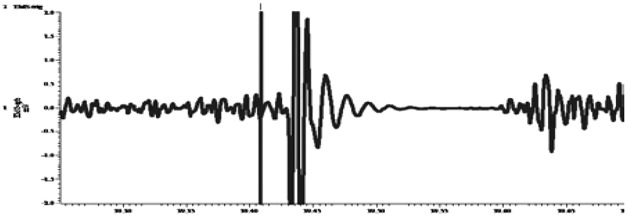
TABLE 1.
A brief summary of TMS measures of cortical excitability and their relationship to neurotransmitters
| TMS Measure | MEP (right anterior pollicis brevis response, following TMS to the left motor cortex) | Neurochemistry Involved | Select References |
|---|---|---|---|
| Resting motor threshold |  |
Ion channels (voltage-gated Na+, AMPA glutamate) | Ziemann and Rothwell (2000), Di Lazzaro et al. (2008) |
| Paired pulse facilitation (long interval facilitation, 15 ms) |  |
Glutamate (AMPA, NMDA) | Reis et al. (2008) |
| Paired pulse inhibition (short interval inhibition, 3 ms) |  |
GABAa | Ziemann et al. (1996), Di Lazzaro et al. (2000a), Korchounov et al. (2005) |
| Cortical silent period |  |
GABAb, dopamine | Ziemann et al. (1993) |
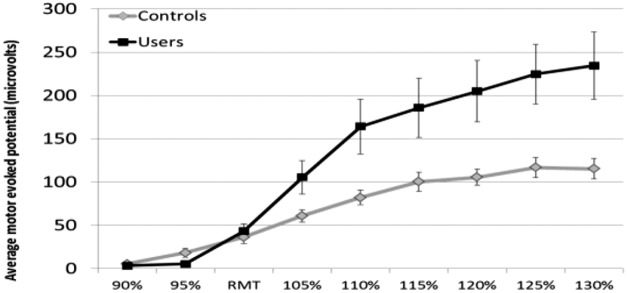
| Recruitment curve (dose–response curve) |  |
Causal relationship between TMS input and MEP output | Hanlon et al. (2015a) |
